By Michael Roberts
Last week, the second estimate for the US real GDP in Q3 of 2023, i.e. national output, was released. It came in at 5.2% on an annualised basis. That seemed a very strong figure, only surpassed in the recent period by Q4 2021, when the US economy was recovering fast from the pandemic slump of 2020.
But this is a weird way of measuring GDP. The annualised figure does show the pace of growth in any quarter – but it is misleading. That 5.2% annualised figure means the US economy actually grew 1.26% in the quarter over the previous quarter (5.2/4 quarters). That’s still pretty strong compared to the trend in recent quarters. But another measure of real GDP growth is to compare the GDP in one quarter with where it was in the same quarter one year ago. This is the year-on-year figure, mostly used in other countries to gauge the growth rate in an economy. In Q3 US GDP rose 3.0% yoy compared to 2.4% yoy in Q2, still the strongest rate since the first quarter of 2022, but not over 5%.
Latest US economic figures fill mainstream commentators with optimism
Also last week, we got the latest measure of inflation in prices in the US economy. Having peaked at 8.9% yoy in June 2022, the ‘headline’ inflation rate is now down to 3.2% yoy in October 2023. Similarly, the inflation rate for the prices of goods and services bought by American households, called the personal consumption expenditure (PCE) index, has fallen from a peak of 7.1% in June 2022 to 3.0% in October 2023. The PCE is the measure that the US Federal Reserve economists follow most closely for interest-rate policy.
Both the CPI and PCE inflation rates have more than halved. At this rate of decline, the US inflation rate could be back to the target set by the US Federal Reserve of 2% a year pretty soon. But there is a caveat to that. If food and energy prices are excluded from the price index, then ‘core’ CPI inflation, as it is called, has not fallen so much: from a peak of 6.6% yoy in September 2022 to 4.0% in October. That suggests that the main driver of falling inflation up to now has been falling energy and food prices. Other prices have been ‘stickier’ in coming down.
As for jobs, the official rate of US unemployment at the last count was 3.9% – it’s been ticking up since April when it fell to 3.4%, a figure below that of end 2019 just before the pandemic broke. So unemployment is now rising, but still low by historic standards. Also, average hourly earnings from wages are now rising faster than inflation, so real incomes from work (before tax and benefits) are improving.
Consensus amongst economists has changed since the start of the year
No wonder the consensus view among economists has swung from pessimism at the beginning of this year about the economy (with forecasts of recession ie. falling output for at least two consecutive quarters) to optimism and the ruling out of a slump in the US economy, not only now but in 2024 onwards.
Take the view of the economists at Goldman Sachs, the leading investment bank in the US. GS economists report that “the global economy has outperformed even our optimistic expectations in 2023. GDP growth is on track to beat consensus forecasts from a year ago” and “we continue to see only limited recession risk”. So, they conclude, the US Federal Reserve’s policy of hiking interest rates has succeeded in getting inflation down without incurring a slump in production and employment – at least in the US. As the GS economists put it, the US economy is on “its final descent to a soft landing”, with real GDP growth projected to expand 2.1% in 2024.
This is what is sometimes called a ‘Goldilocks’ outcome ie the US economy is not too ‘hot’ that inflation stays high and not too ‘cold’ that there is a contraction in output and rising unemployment. And this is happening despite the Ukraine-Russia war and now the Israel-Gaza nightmare. Perfect!
Have we really seen a ‘Goldilocks’ outcome?
But hold your horses! Let’s re-examine each of these measures of the health of the US economy before accepting the Goldilocks scenario is in operation. First, there is another measure of economic growth other than the change in gross domestic product (GDP). There is gross domestic income (GDI). In macroeconomic accounting both these measures should be equal in theory. GDP measures the total value of goods and services produced in an economy. GDI measures aggregate income received across all sectors of the economy, including wages, corporate profits, and tax receipts from that output. Accounting-wise, these two measures should add up to the same. But the measures can vary because the data to measure them come from different sources.
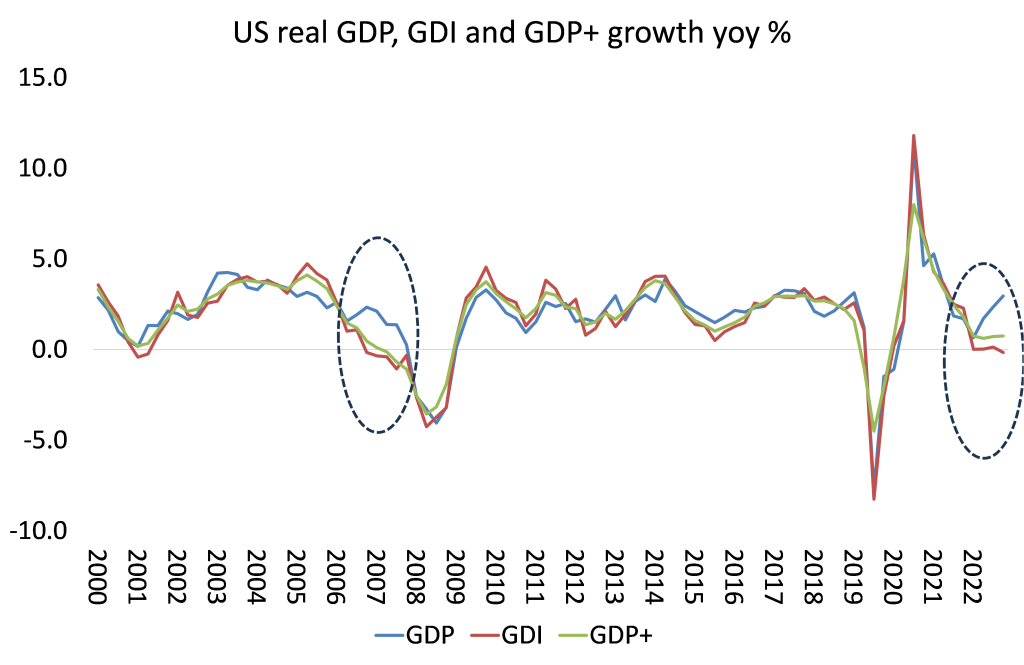
However, currently GDP and GDI growth rates are diverging to a degree not seen since 2007, just before the Great Recession of 2008-9. As said above, US GDP growth was (an annualised) 5.2% in Q3 this year, but GDI growth was just 1.5% annualised. And although GDP yoy growth has slowed, it remains positive, implying a strong economy, but GDI yoy has been falling for two consecutive quarters, implying a recession.
Why the big difference? And which measure is more accurate? Various explanations have been presented. It’s ‘statistical noise’ that will subside and both measures will soon be in line. That’s one answer. Another is that, according to the official statisticians at the US BEA, “corporate profits, proprietors’ income (small business and self-employment income), and capex are the components of GDP/GDI that are most prone to revision.” In other words, production of goods and services may rise but that may not be translated into increased incomes (profits and wages).
A big part of GDP growth is just a build up of unsold inventories
Indeed, the strong GDP figure was partly due to a large rise in inventories or stocks of unsold goods, not earning any revenue. Private inventory investment contributed 1.3 percentage points to GDP in Q3. Inventory swings could even subtract from GDP in future quarters, bringing it closer to the GDI measure. If you strip out the build-up of stocks and just measure the increase in actual sales (after inflation), then sales growth was about 2% yoy in Q3, not over 3% yoy as measured in GDP. Real final sales are still 7-8% below pre-pandemic trend growth.
GDP has been growing faster than GDI because there is more consumer borrowing (and running down savings) and because there is more production without sales. So the GDI measure may well be more accurate about what is happening to the US economy than GDP. Over the last four quarters US GDP is up 3.0% while US GDI is down 0.2%.
The average of the two is 1.4% over the last four quarters. One answer to this conundrum then is to do an average of the two measures. The Congressional Budget Office (CBO) does that. There is also a similar combined measure called GDP-plus, produced by the Philadelphia Federal Reserve.
Comparing the different ways of measuring growth
I put these three measures together in the graph below. I think it is significant that the GDI and GDP diverge most when production growth is being driven more by credit than by increased revenues (wages and profits), as just before recessions. Since the pandemic, real wages have fallen behind inflation and now profits for all companies have also started to slow sharply. That’s a sign that GDP growth may well slow soon as well.
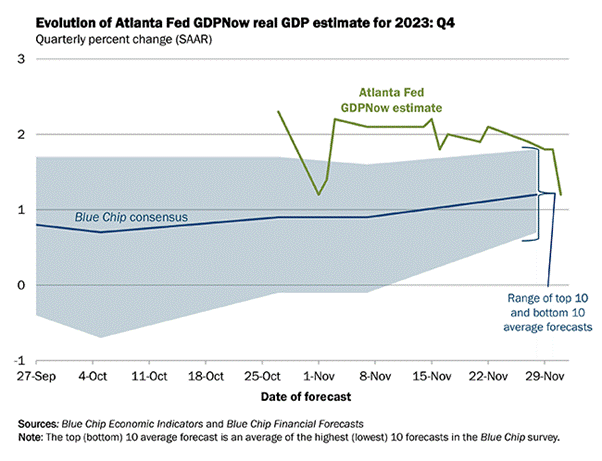
Indeed, the latest forecast by the well-followed Atlanta Fed GDP Now model reckons real GDP growth in this current Q4 quarter is likely to be just 1.2% at an annualised rate, or up only 0.3% on Q3.
Then there is the issue of inflation. Is it really heading back to ‘normal’ or low rates? The first thing to say on this is that inflation means inflation of price levels. Prices of the average basket of goods and services or of all commodities are not falling in the US, or elsewhere. Since the end of the pandemic, average price levels in the US have risen 17.5%. A gallon of milk costs 7% less than at its peak, but the price is about 23% higher than in early 2020. Meanwhile, rents and housing prices remain stubbornly high, as do mortgage rates.
Wages not keeping up with the effect of rising prices
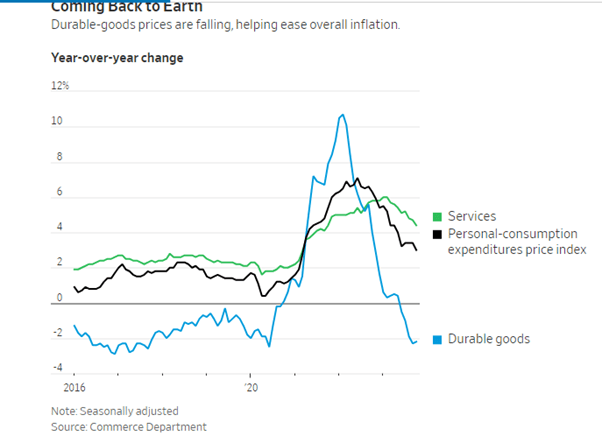
Even Jared Bernstein, the chair of Biden’s Council of Economic Advisers, has acknowledged that, while slowing inflation is “extremely welcome…people want to hear about falling prices, because they remember what prices were, and they want their old prices back.” They are not going to get those old prices back, although it is true that ‘durable goods’ (household appliances etc) prices are falling.
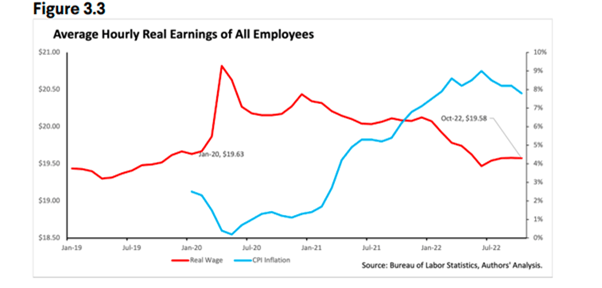
All that has happened is that the rise in price levels is slowing and now wages are rising to match or surpass current inflation. But wages have not risen enough in the last three years to compensate for that 17.5% rise in prices.
Moreover, the inflation rate is down, not really because of anything done by central banks, namely hiking interest rates to squeeze ‘aggregate demand’ and thus slow spending growth. The main reason for the slowing inflation rate is the fallback in energy and food prices – in other words, key raw material and commodity prices. In this blog, I have reviewed arguments over whether post-pandemic inflation was caused by “excessive demand” or “weak supply” from supply chain blockages. The evidence has mounted that inflation was kicked started by the latter and the former only came into play as result of the latter.
How supply chain blockages fuel inflation
Marxist theory suggests that there is tendency for prices to fall over time as productivity growth rises and costs per unit of production fall. Indeed, before the pandemic, durable-goods prices fell an average of 1.9% a year from 1995 to 2020 as globalisation shifted US manufacturing production to low-wage countries and productivity improvements lowered costs.
But if production is disrupted, then the opposite will occur. Post-pandemic, product shortages snarled supply chains and a surge in demand from consumers flush with cash sent prices soaring in 2021 and 2022. Durable-goods inflation peaked at a 47-year high of 10.7% in February 2022.
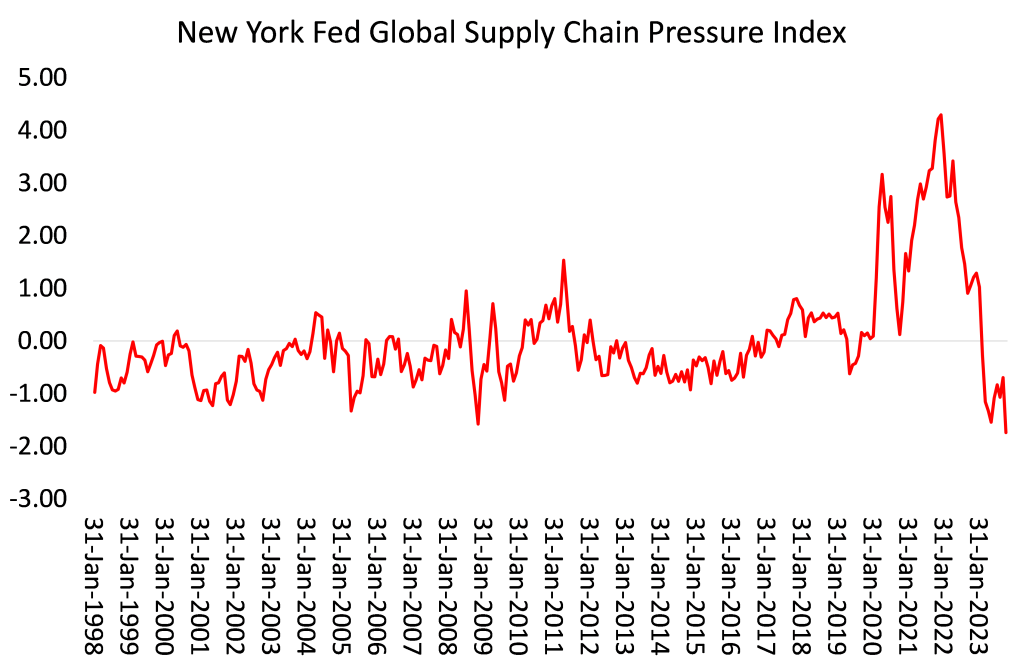
Research by Adam Shapiro, an economist at the San Francisco Fed, finds that supply disruptions such as those from closed factories or shipping backups accounted for roughly half the run-up in inflation in 2021 and 2022. Today, supply chains are running smoothly, according to a New York Fed index.
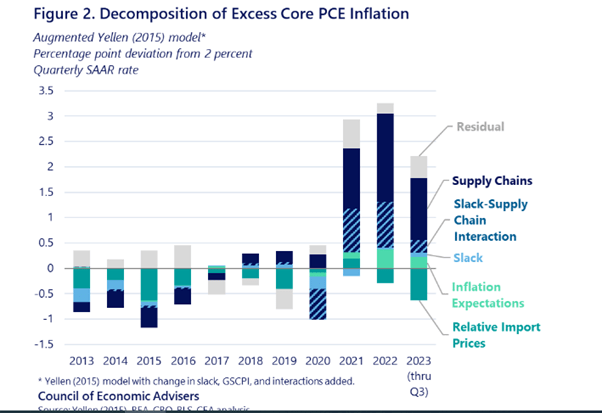
The White House Council of Economic Advisers (CEA) estimated better-functioning supply chains accentuated by weaker demand accounted for roughly 80% of the fall in inflation since 2022. The CEA reckoned that inflation after the pandemic was driven by two primary factors: pandemic-driven supply-chain bottlenecks and strong consumer demand, which includes compositional shifts in demand from goods to services. Moreover, supply and demand do not occur in isolation; they interact with one another. Supply chain disruptions are more inflationary if they occur in the context of strong demand, where they are more likely to bind, than in a weak one where demand is slack.
The CEA found that supply chains, either alone or interacted with slack, explain most of the excess core inflation from 2021-23. Likewise, supply chains in some form—either alone (purple bars in Figure 2) or in tandem with slack, explain more than 80 percent of the disinflation the US has experienced since 2022. By contrast, because the unemployment rate has not changed much since 2022, the model assigns little effect to labour market slack on its own – the latter being the usual Keynesian explanation of inflation.
Another mainstream report did a similar exercise and found that “negative supply shocks to factors of production, labor and intermediate inputs, initially sparked inflation in 2020–2021. Global supply chains and complementarities in production played an amplification role in this initial phase.” Then “aggregate demand shocks, due to stimulative policies, widened demand-supply imbalances, amplifying inflation further during 2021–2022.”
80% of inflation rise in 2020 caused by supply shocks
The study reckoned that in 2020 supply shocks contributed about 80% of the inflation rise. And during 2021 it was the improvement in supply chains that led to fall in the inflation rate. “actual inflation would have been much higher without the improvement in supply chains that acted as a disinflationary force (measured via the sector-level supply shock) in the last part of 2021 and throughout 2022.”
They concluded that “The overarching policy implication of our paper is that, in a world with more supply shocks (a fragmented and de-globalized world), at sector or at the aggregate level, we will see more inflation, regardless of the fact that monetary policy stays restrictive.”
What central banks call “going the last mile”
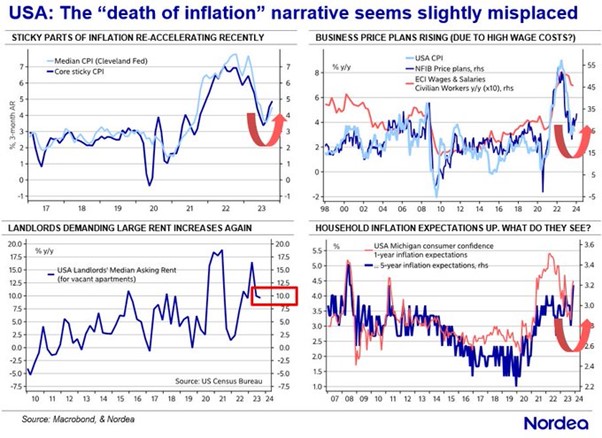
What this suggests is that the continued levels of high interest rates imposed by the Federal Reserve did not get inflation rates down and won’t do so from hereon. So what central banks call ‘going the last mile’ to reach the Fed’s arbitrary 2% a year rate is not likely to be achieved by Fed policies. Indeed, there are signs that inflation may start to rise again.
ECB member Isabel Schnabel discussed the ‘last mile’ for Eurozone inflation: “while it took a year to bring inflation from 10.6% to 2.9%, it is expected to take about twice as long to get from here back to 2%.” A key problem is productivity growth. And US treasury secretary Janet Yellen noted what we have discussed on this blog many times. “Over the last decade, U.S. labor productivity growth averaged a mere 1.1 percent—roughly half that during the previous fifty years. This has contributed to slow growth in wages and compensation, with especially slow historical gains for workers at the bottom of the wage distribution.” When productivity growth is low, then the upward pressure on inflation rises as firms try to compensate for higher unit costs with price increases. Once productivity growth picks up, then unit costs do not rise as fast and inflation can subside. This is clearly revealed in the relation between productivity and prices in the US post-pandemic.
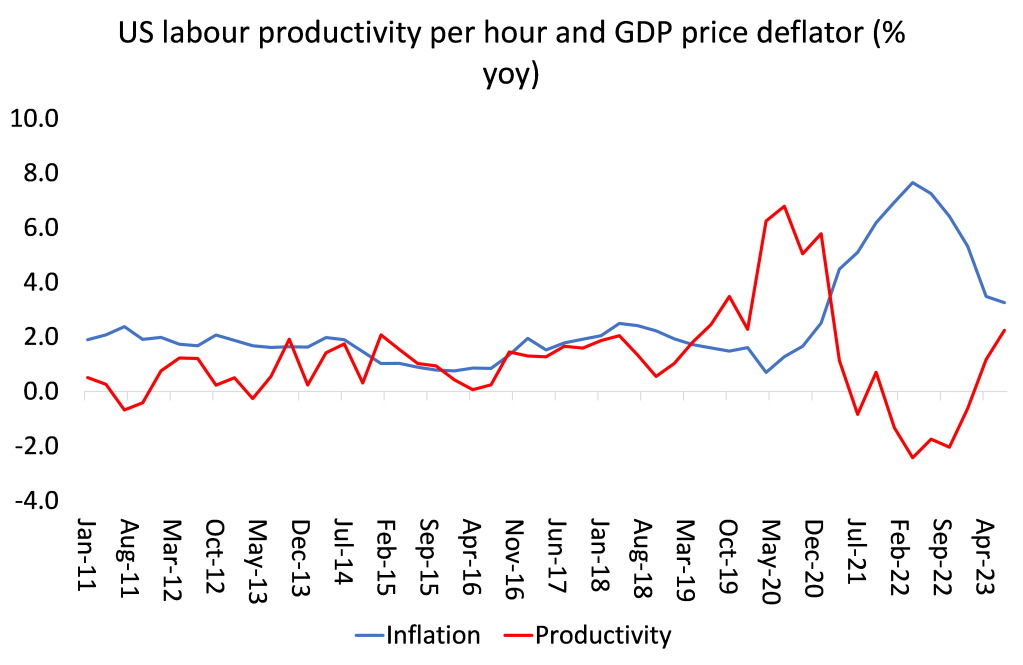
US worker productivity grew at its quickest pace in three years in Q3 2023. But average growth is really only back to the slow rate of growth of the 2010s at best. So that’s likely to make any further reductions in the inflation rate from here much more difficult to achieve.
The effect of meagre productivity growth
As Schnabel put it: “Meagre productivity growth is putting additional pressure on firm’s unit labour costs, which have been rising sharply since the beginning of 2022. Given these rigidities, disinflation will slow down appreciably. For core inflation to evolve in line with ECB staff projections, two key conditions need to be met. One is that the growth in unit labour costs eventually falls back to levels that are broadly consistent with 2% medium-term inflation. The second is that firms will use their profit margins as a buffer to limit the pass-through of the current strong wage increases to consumer prices.”
In other words, productivity growth must rise to reduce costs per unit of production AND companies must stop trying to sustain profit margins at high levels. Otherwise, inflation rates will not come down much further from here and may even start to rise.

The impact of other factors on prices also cannot be dismissed. This year’s El Niño is expected to bring months of extreme heat and rainfall to parts of the world, reinforcing the risks stemming from global warming. This is threatening to disrupt crop cycles and put further pressure on global food markets.
Trends in job creation and unemployment
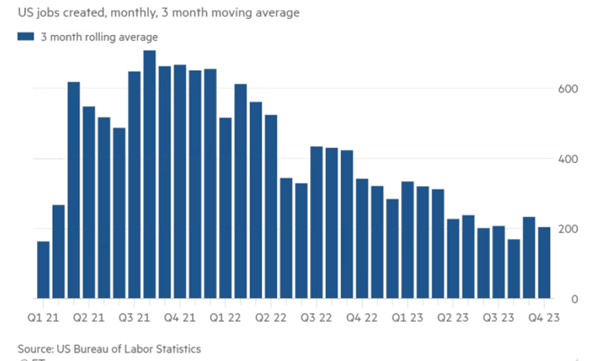
What about employment and jobs? The Goldilocks optimists like the GS economists emphasise how in the US and in most of the major economies, official unemployment rates are at or near all-time lows. Everybody can get a job if they want one, it’s claimed. It seems that, particularly after the experience of the pandemic, employers have tried to keep their workers on the books in case they cannot replace them later (as happened to the airlines which sacked their workforce during the pandemic and then found it difficult to fill the gaps afterwards). Replacing workers with robots is still not happening, so productivity growth is weak.
But now the US labour market is cooling off. Job creation is down this year from the high rates of 2022 and the unemployment rate has risen from a more than 50-year low of 3.4% in April to 3.9% in October. And as I pointed out in a previous post, there is a reliable (Sahm) model that argues if the unemployment rate rises more than 50bp for at least three months, then a recession is likely on its way.
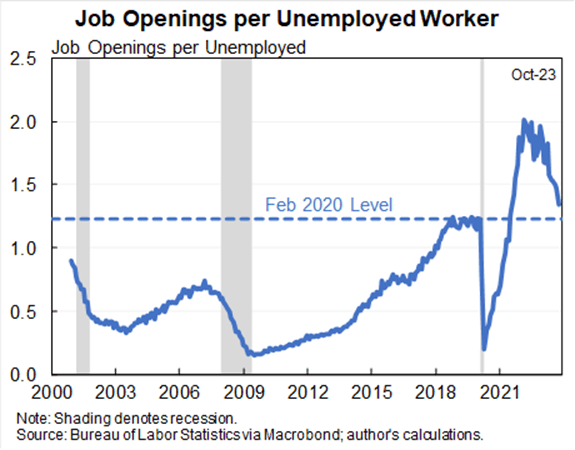
The ratio of job vacancies to people seeking work has fallen, and so has the rate of people voluntarily quitting their jobs. Similar declines have happened only three times since 2000: in the dot.com bubble burst of 2001; the financial crash of 2008 and the pandemic slump of 2020.
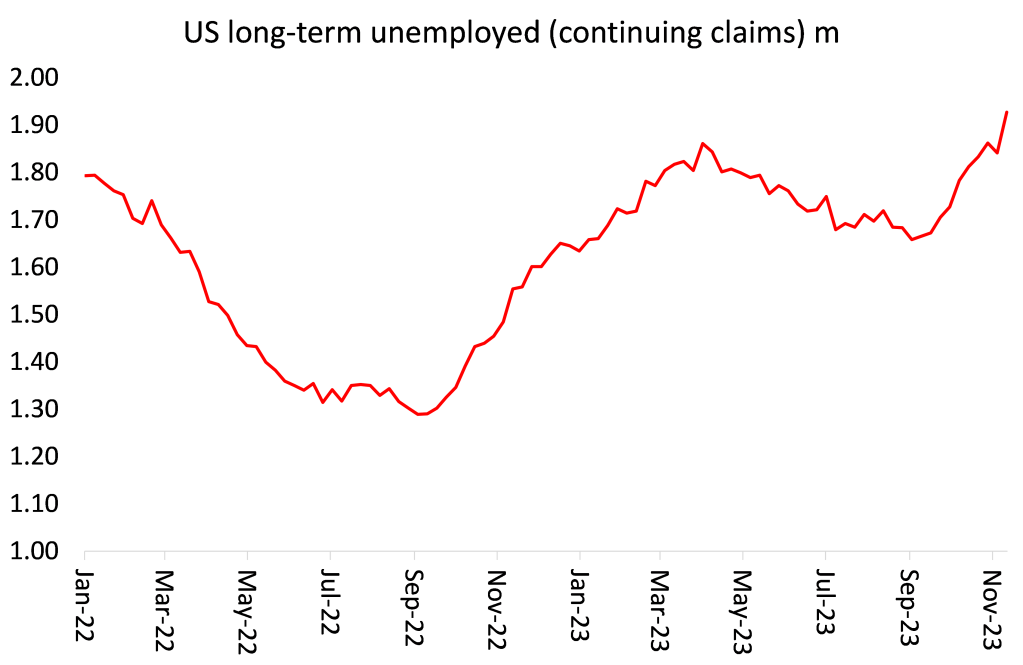
And if you look at long-term unemployment (out of work for more than six months), then things are getting worse. You may still be able to get a job in America (low-paid and/or part-time) but if you lose that job, it’s getting more difficult to get another.
Figures for investment and productivity tell a different story
But here is the main thing. The economic indicators that the optimists and mainstream economics single out to judge the health of a capitalist economy are mainly ‘lagging’ indicators’. They look at employment, consumer spending, GDP and prices. But Marxist theory tells us that what drives capitalist economies first is profits; then profits as invested in productive investment (this raises the productivity of labour and output, not invested in fictitious capital like stocks and bonds); and only then does investment and production growth feed down to employment, wages and consumer spending. And when we look at these ‘forward looking indicators of the US economy, it is not so rosy.
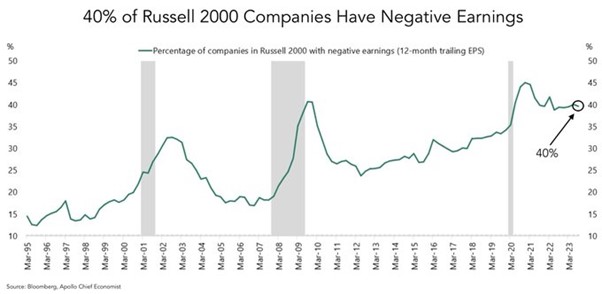
First, corporate profit growth is dropping away.
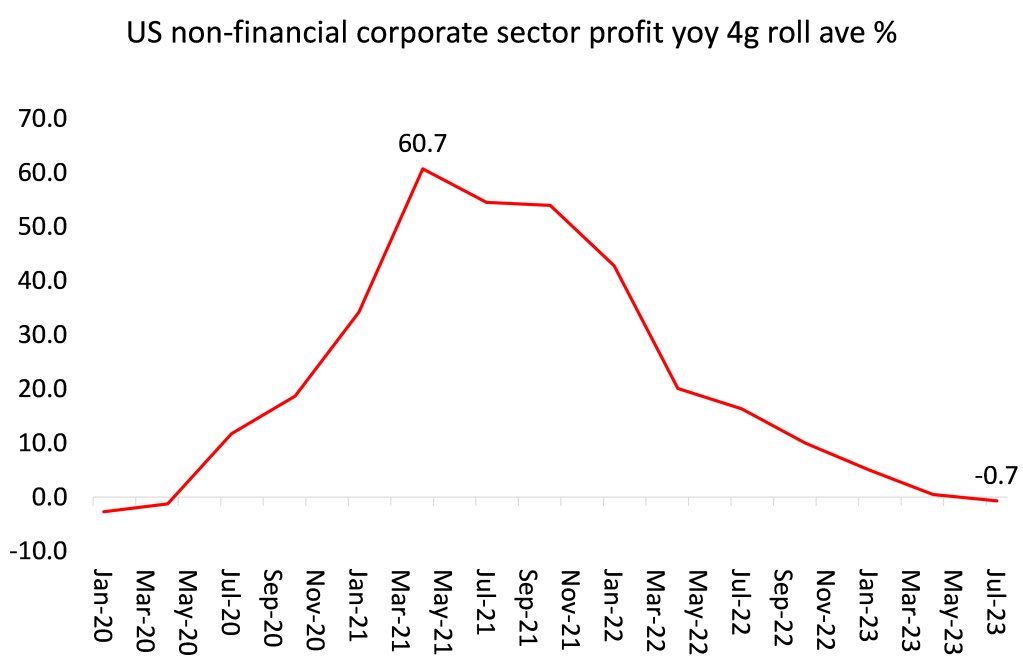
Indeed, 40% of the top 2,000 companies in the US now have negative earnings.
With profit growth dropping off, business investment growth is beginning to follow (it usually follows with up to a year’s lag).
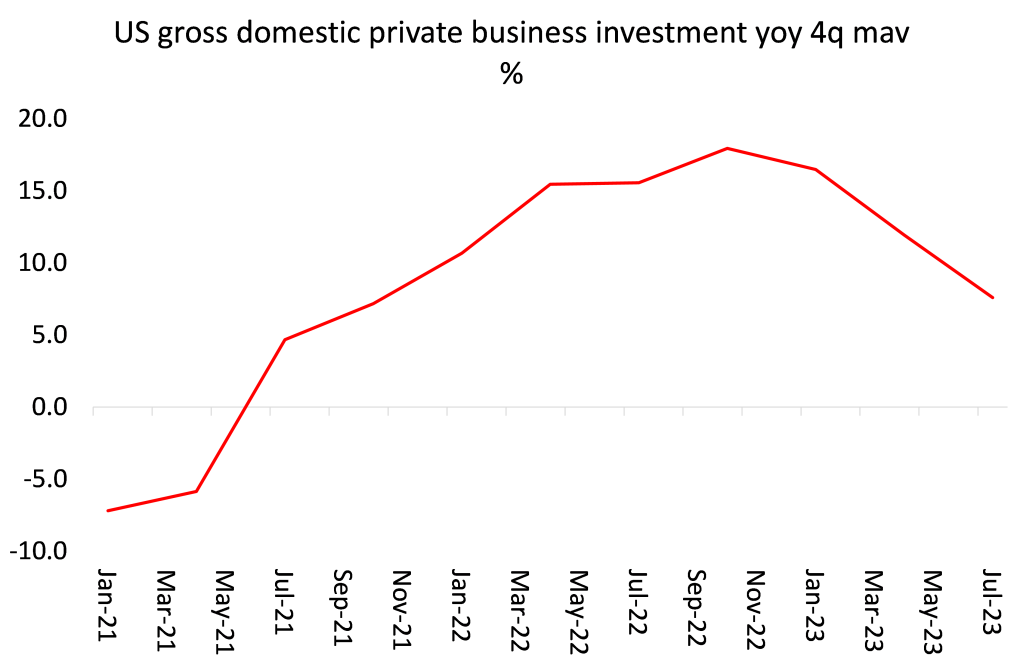
During 2024, slowing growth in investment will keep productivity growth weak. Why? Well, a recent McKinsey report found that the productivity slowdown has mainly come from a decline in capital per worker and in innovation ie productive investment: “since the Great Recession, capital intensity, or capital per worker, in many developed countries has grown at the slowest rate in postwar history. An important way productivity grows is when workers have better tools such as machines for production, computers and mobile phones for analysis and communication, and new software to better design, produce, and ship products, but this has not been occurring at rates that match those recorded in the past. A decomposition of labor productivity shows that slowing growth of capital per hour worked contributes about half or more of the productivity decline in many countries.”
The likely causes of an economic slump in the US
I have argued in previous posts that a slump in the US economy would happen when profit growth stops and rising interest rates push up borrowing costs for companies that look to invest. These two blades have been closing.
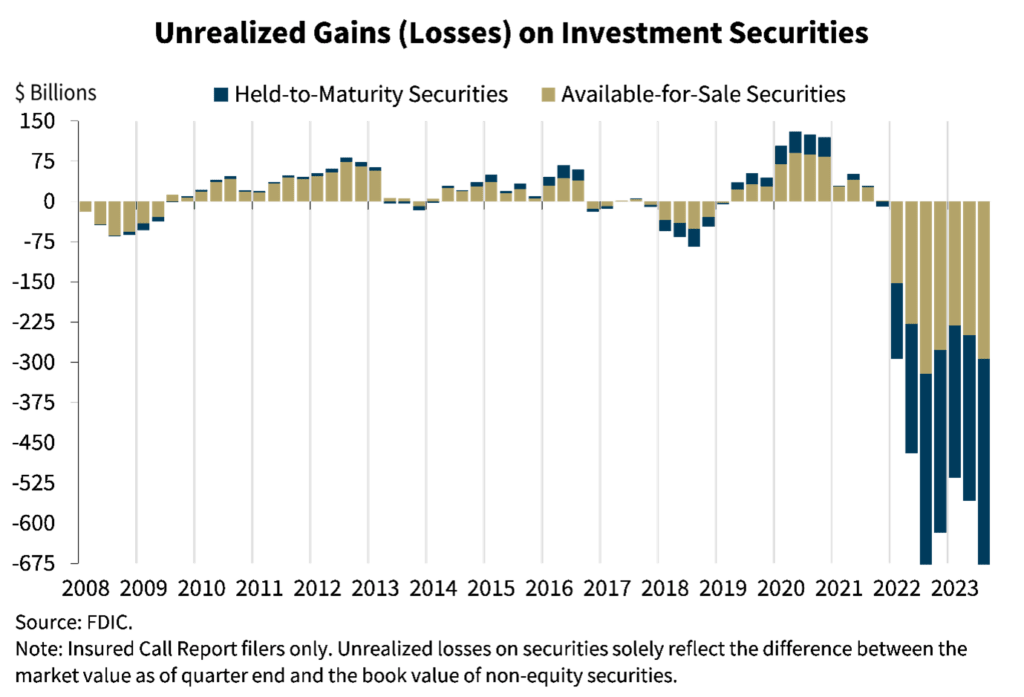
With debt servicing costs rising, many small companies are struggling to make ends meet and bankruptcies are rising. The huge backlog of so-called zombie companies that are drip fed by the banks to keep them going are still there. If they start to fall over, then the banking crisis experienced earlier this year will resurface. US banks still have huge ‘unrealised’ potential losses from the bonds on their books.
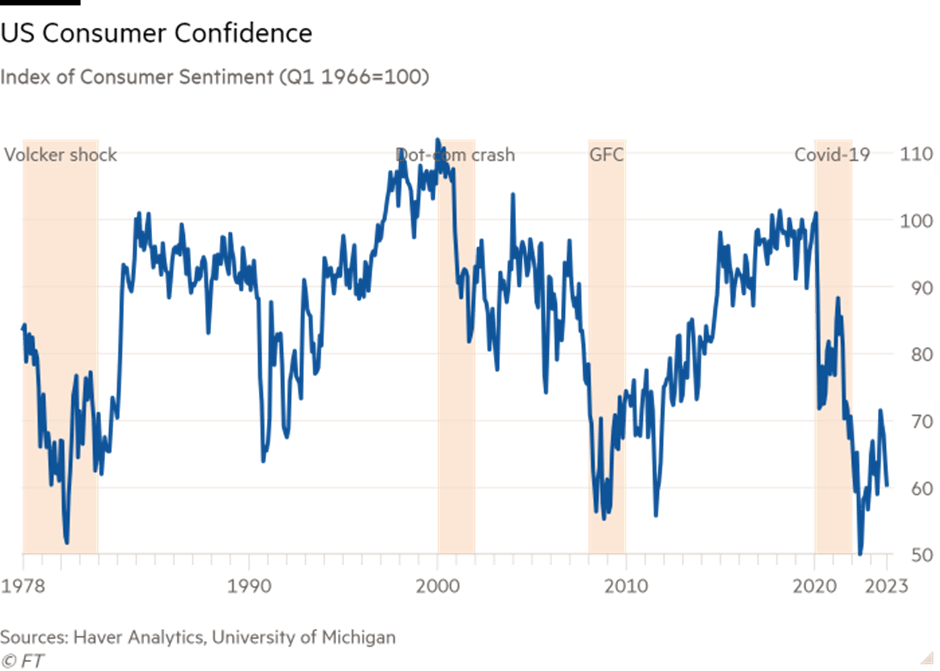
The optimists are puzzled at why Americans, on the whole, are very pessimistic about the US economy despite their rosy picture. The explanation they have come up with is that US households are either stupid or biased politically against the Biden administration!
US consumer confidence remains low
Perhaps more likely is that with average prices up 17-20% in two years, wages not rising to match that; transport and infrastructure neglected; student fees and debt rising again; record house prices; rising credit and mortgage costs; and government money going to fund wars elsewhere, Americans are not so convinced that all is well.
And remember the US economy is the best performing of the major advanced capitalist economies. Many in Europe are already in recession or near to it (Germany, France, Netherlands, Sweden and the UK). Japan is back into contract territory too and Canada has suffered four consecutive quarters of contraction in GDP. Virtually every major economy’s manufacturing sector is contracting with little sign of turning around, while global trade is also going down.
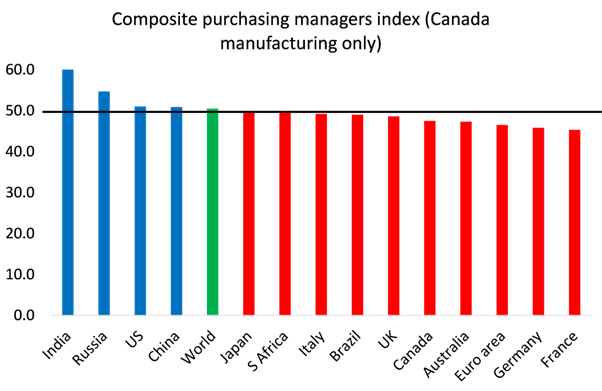
So the Goldman Sachs economists may be taking a victory lap over their forecast that the US economy would avoid a recession in 2023 that many others (including me) thought was coming, but the underlying fault lines in the US economy remain and are likely to surface in 2024.
From the blog of Michael Roberts. The original, with all charts and hyperlinks, can be found here.


