By Michael Roberts
Marx’s law of the tendency of the rate of profit to fall (LTRPF) argues that, over time, the profitability of capital employed will fall. Marx reckoned this was “the most important law of political economy” because it posed an irreconcilable contradiction in the capitalist mode of production between the production of things and services that human society needs and profit for capital – and it would generate regular and recurring crises in investment and production.
Marx’s law has been attacked theoretically as erroneous, illogical and indeterminate and it has been rejected as empirically disproven. However, various Marxist economists have provided a robust defence of the law’s logic. (Carchedi and Roberts, Kliman, Murray Smith.) And the body of empirical evidence supporting a long-term falling rate of profit on capital accumulated has mounted over the years.
New contribution from Tomas Rotta and Rishabh Kumar
Now Tomas Rotta from Goldsmith University of London and Rishabh Kumar from the University of Massachusetts have made another important contribution to the empirical evidence supporting Marx’s law of the tendency of the rate of profit to fall. In their paper, Was Marx right? Development and exploitation in 43 countries, 2000–2014, R&K find that Marx’s law is right: capital intensity rises faster than the rate of exploitation and so the global profit rate declines.
They generate a new panel dataset of the key Marxist variables from 2000 to 2014 using the World Input Output Database (WIOD) covering 56 industries across 43 countries in the 2000-2014 period. “To the best of our knowledge, ours is the first ever attempt at producing a comprehensive global dataset of Marxist variables.”
R&K find that the average profit rate declined at the world level from 2000 to 2014. They add that the rate of profit on total capital declined as per-capita GDP for a country rose owing to the greater share of unproductive capital in rich countries. Given that unproductive activities increase with economic development, “our finding adds a second mechanism to Marx’s original prediction about the falling rate of profit.”
Isolating the rate of profit in the productive sectors
The big advantage of the R&K’s study is that it can produce a rate of profit based on the productive sectors of economies. In Marxist theory, it is only these sectors that generate new value from capital investment and not just redistribute value already created. So it is the rate of profit in these productive sectors that best indicates the health and direction of the capitalist economy; as the rate of profit in the non-productive (financial, retail, commercial and property) sectors ultimately depends on the rate of profit in the value-creating productive sectors.
R&K point out that previous estimates of the rate of profit at a global level could not make this distinction (see Basu et al. (2022) and my work on this question). But using industry-level data from the Socio-Economic Accounts (SEA) of the World Input-Output Database (WIOD) and country-level data from the Extended Penn World Tables (EPWT), R&K recalculate the value added of every industry using the decomposition between productive and unproductive activity.
Findings on the global rate of profit
They find that the global rate of profit on both total and private capital reached a peak at 13.7% just prior to the 2008 financial crisis, then plummeted and continued a gradual decline to 12.7% in 2014 (see graph below, top left). This was accompanied by a rise in the organic composition of capital (the ratio of fixed assets and raw materials to wages of labour) – graph bottom left, which rose faster than the rate of surplus value (profits over wages) – graph top right – all in accordance with Marx’s law of profitability. And this overall fall was driven by a fall in the rate of profit in productive sectors (graph bottom right).
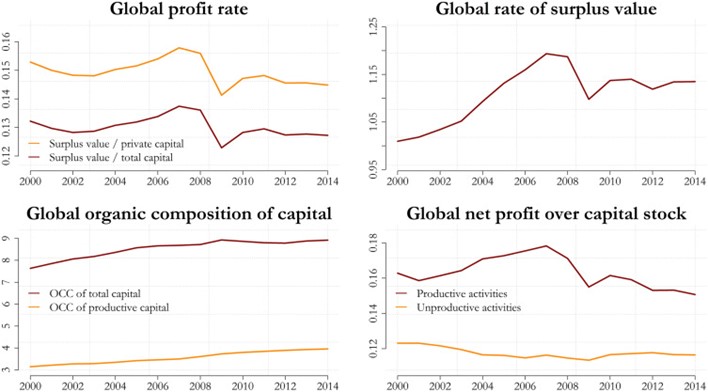
“The increase of 12.4% in the rate of surplus value suggests that the decline in the global rate of profit was driven by a larger increase in capital intensity. The productive capital-labor ratio rose 25.8% (from 314% to 395%) while the total capital-labor ratio rose 16.8% (from 763% to 892%) over 2000–2014. The decline in the world rate of profit was therefore driven by the faster growth of the global c/v compared to the growth in s/v, as Marx expected.”
Another advantage of R&K’s dataset is that it enables the decomposition of the Marxist variables for the rate of profit within countries and between countries. They find that “in just 15 years, China rapidly increased its weight in global value added from 5.3 to 19.3%. Concurrently, the weight of the United States in global value added fell from 30.1 to 22.3%, and Japan’s weight shrunk from 16.3 to 6.7% in the same period. Although the shares are smaller, there is also a rapid downward shift for Germany from 6.6 to 6.0%.”
China also became the country with the greatest share of the global capital stock in productive activity, rapidly increasing its weight from 6.0 to 23.6%. This compared to a fall of the United States’ weight from 24.8 to 17.4%, Japan from 21.2 to 8.8%, and Germany from 6.5 to 4.6%. Not surprisingly, the United States dominated the shares of global income and capital stock in unproductive activity i.e. finance, real estate and government services. The US and the UK are increasingly ‘rentier economies’, living off the new value created in China and other major productive economies.
The rate of surplus value is higher in poor countries
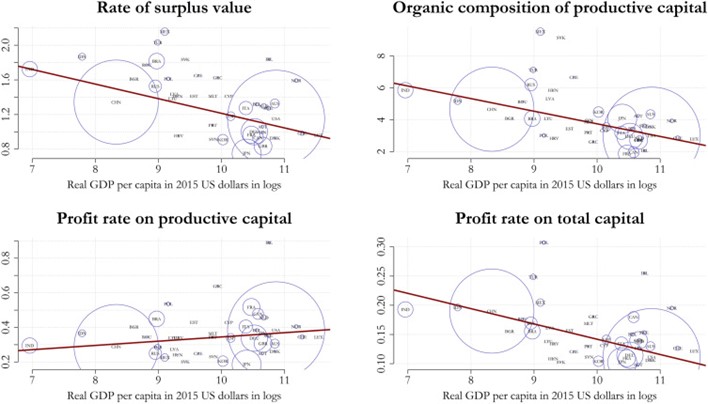
According to R&K, following Marx, the advanced capitalist economies should exhibit higher rates of surplus value, higher organic composition of capital and lower average profit rates. And yet, they found that the rate of surplus value is higher in poor countries. Their answer is to this is that the level of wages is much higher in the rich countries compared to wages in the poor countries – a differential that is sufficient to make the rate of surplus value higher in the latter. “Wage rates per hour are an order of magnitude higher in rich countries: while the ratio of labor productivity between India and USA is 5%, the ratio of wages is only 2%. Thus, being a worker in India implies substantially lower wages than being a worker in France or Germany.”
This is similar to the explanation that Carchedi and I made in our paper on modern imperialism, where we also found a higher organic composition of capital in the imperialist economies, but also a higher rate of surplus value in the periphery. (see graph below, top left). However, R&K reckon this outcome provides empirical support to the super-exploitation thesis of Ruy Mauro Marini and others. But I don’t think this follows.
Low wages do not have the same meaning that Marx gave to ‘super-exploitation’. He defined that as when wage levels are below the value of labour power, which would be the amount of value necessary to reproduce the labour force. As argued at length in our book, Capitalism in the 21st century pp134-140, average wage levels in poor countries do not have to be below any value of labour power to lead to higher rates of surplus value in these countries.
A higher rate of profit on productive capital in rich countries
R&K find that richer countries have lower profit rates which they argue is due to the greater stock of fixed capital tied up in unproductive activity in the rich countries (graph bottom right). This is because the data show a higher rate of profit on productive capital in rich countries (graph bottom left).
All these results are a valuable contribution to supporting Marx’s law of profitability. But R&K’s approach has limitations. As they point out, the time series using the WIOD is very short, just 15 years from 2000 to 2014. But more important, input-output tables have some theoretical disadvantages as they measure inputs and outputs (whether in money or labour terms) in the same year, like a snapshot. They do not measure production prices and profit rates dynamically. That’s where the Basu-Wasner data using the EWPT database (see above), although it cannot distinguish between productive and unproductive sectors, has an advantage in indicating changes and trends over time.
Analysis of the rate of profit in the US
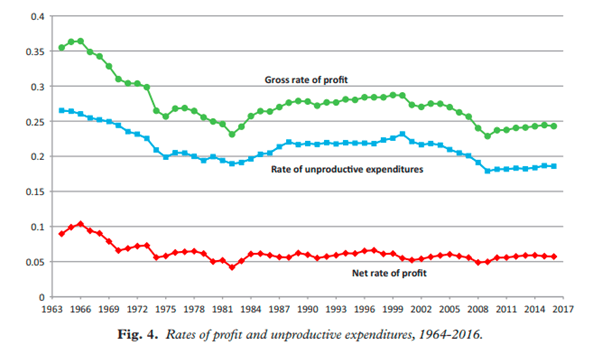
And there have been attempts to use national data to generate rates of profit for productive and unproductive sectors. Tsoulfidis and Paitaridis (T&P) did so here. Their results for the US show that, in the 1990s, there was a rise in the overall (gross) rate of profit in the neo-liberal period from the early 1980s to the end of the 20th century, but the rate of profit in the productive sectors (net profit rate) of the US economy did not rise and capitalist investment went more into unproductive sectors (finance and real estate).
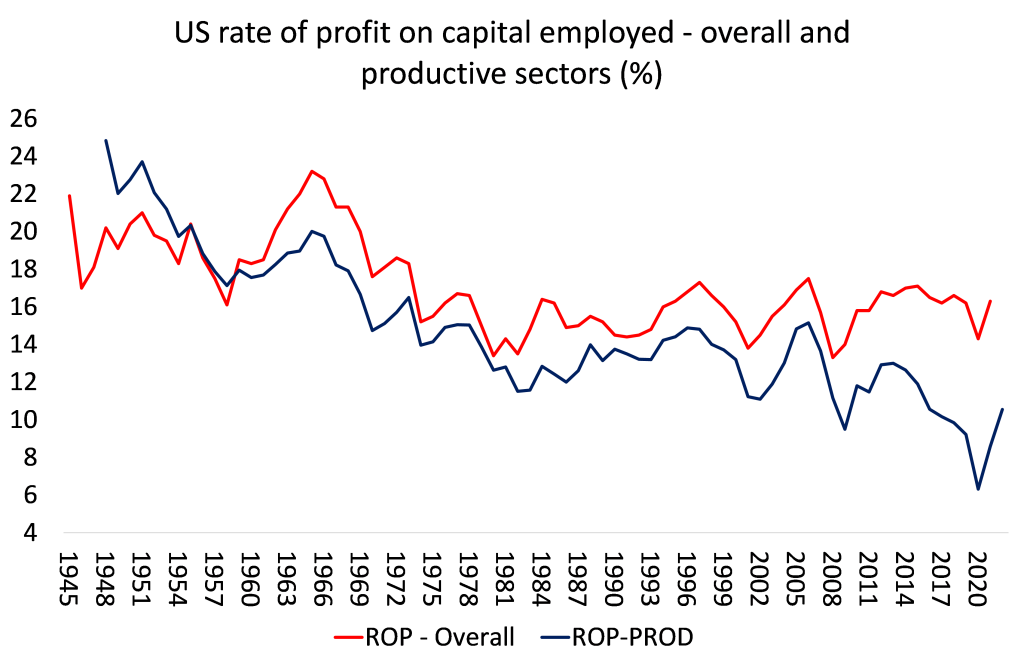
In a recent piece of (unpublished) work by me, which also breaks down the rate of profit between the productive sectors (using similar categories as R&K) and the overall US economy, I get a similar result to T&P. The gap between the ‘whole economy’ rate of profit and the rate of profit in the productive sectors widened from the early 1980s. The overall rate has been pretty static since 1997, but profitability in the productive sectors, after rising modestly in the 1990s, has fallen back sharply since about 2006. US capitalists are finding better profits in unproductive sectors. That damages productive investment.
But these results are for the US only. Only R&K have produced, as they say, the first set of Marxist variables that distinguishes the productive from the unproductive sectors for the world and thus throws more light on the health of capitalist production – an important step in the empirical work supporting Marx’s law.
From the blog of Michael Roberts. The original, with all charts and hyperlinks, can be found here.

