By Michael Roberts
Back in 2021, Guglielmo Carchedi and I published a paper on Historical Materialism called The Economics of Modern Imperialism. The paper focused exclusively on the economic aspects of imperialism. We defined that as the persistent and long-term net appropriation of surplus value by the high-technology advanced capitalist countries transferred from the low-technology dominated countries. We identified four channels by which surplus value flows to the imperialist countries: currency seigniorage; income flows from capital investments; unequal exchange (UE) through trade; and changes in exchange rates.
We did not deny other aspects of imperialist domination of the majority of world i.e. in particular, military power and political control of international institutions (UN, IMF, World Bank etc) and the power of ‘international diplomacy’. But in the paper we focused on the economic aspects, which we argued was the ultimate determining factor driving these other extremely important, but determined traits, like military and political domination, as well as cultural and ideological pre-eminence.
In that paper, we paid particular attention to the quantification of unequal exchange (UE) i.e the transfer of surplus value through international export trade. We used two variables in our analysis of UE: the organic composition of capital and the rate of exploitation, and we measured which of these two variables was more important in contributing to UE transfers.
Transfer of value from the ‘developing economies’ to the imperialist bloc
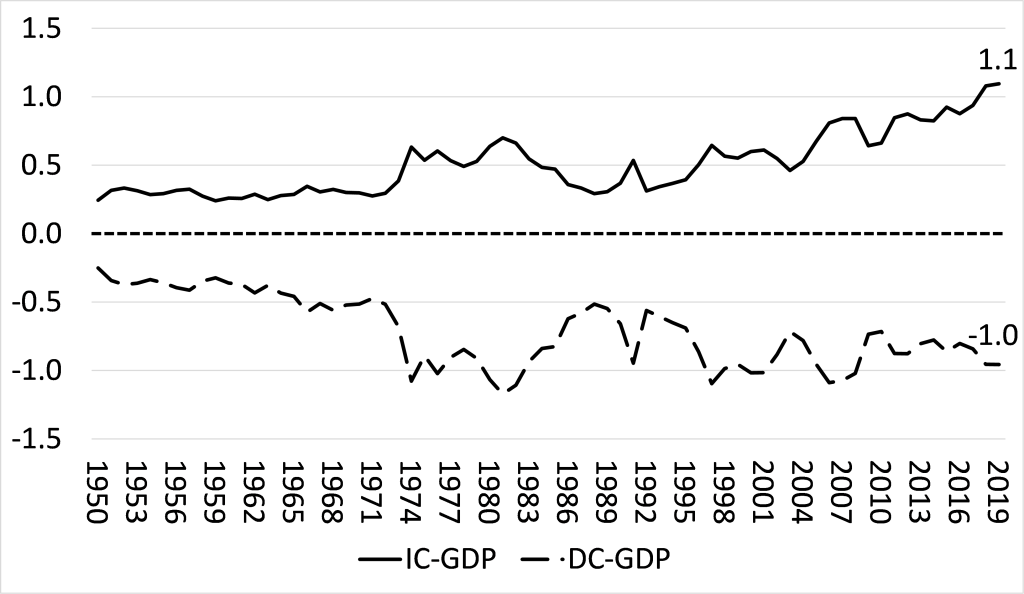
We found that since the end of WW2, the imperialist bloc (IC) annually got around 1% of their GDP through the transfer of surplus value in international trade from the rest of the major ‘developing’ economies (DC) in the G20; while the latter lost about 1% of their GDP in surplus value transferred to the imperialist bloc. And these ratios were rising.
The other large area of transfers of income came from the international flow of profits, interest and rent appropriated by the imperialist bloc from their investment in assets, both tangible and financial, in the periphery. We measured this from the net flows of profits, interest and rent to the imperialist bloc – what the IMF calls net primary credit income – compared to those of the rest of the G20.
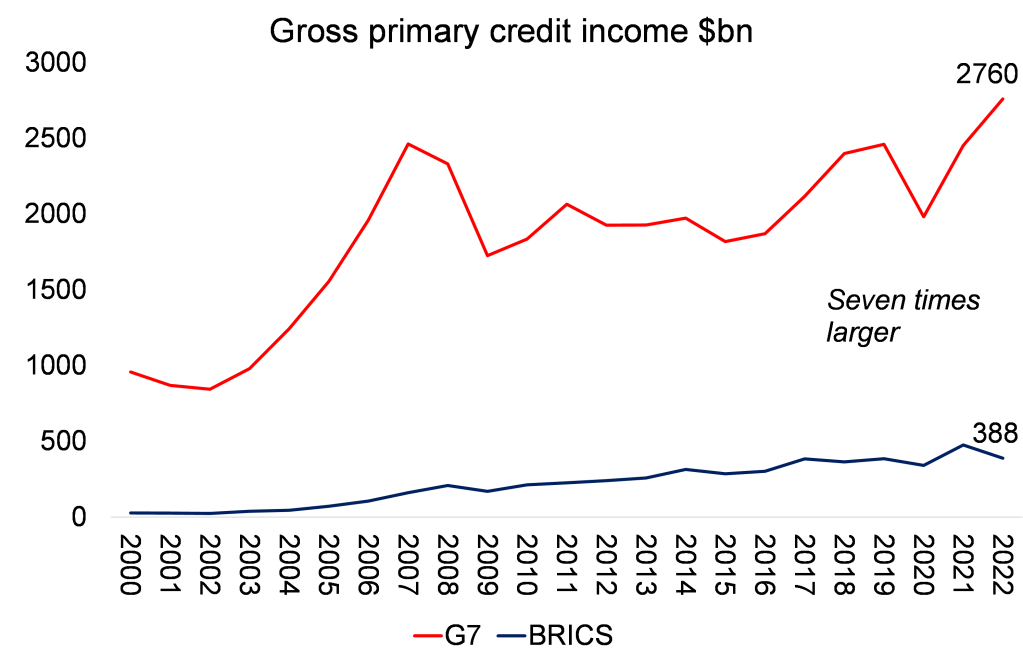
Gross income flows to the G7 are seven times greater than those to BRICS
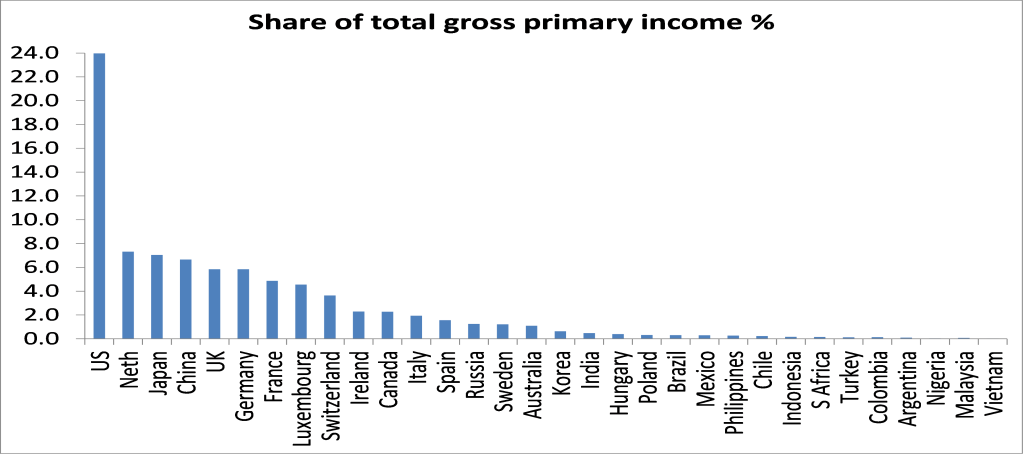
For this post, I decided to update that aspect of economic domination by first comparing the gross primary credit income flows for the G7 and BRICS economies. I just looked at the years of the 21st century. The gross income flows to the G7 are now seven times greater than those received by the BRICS.
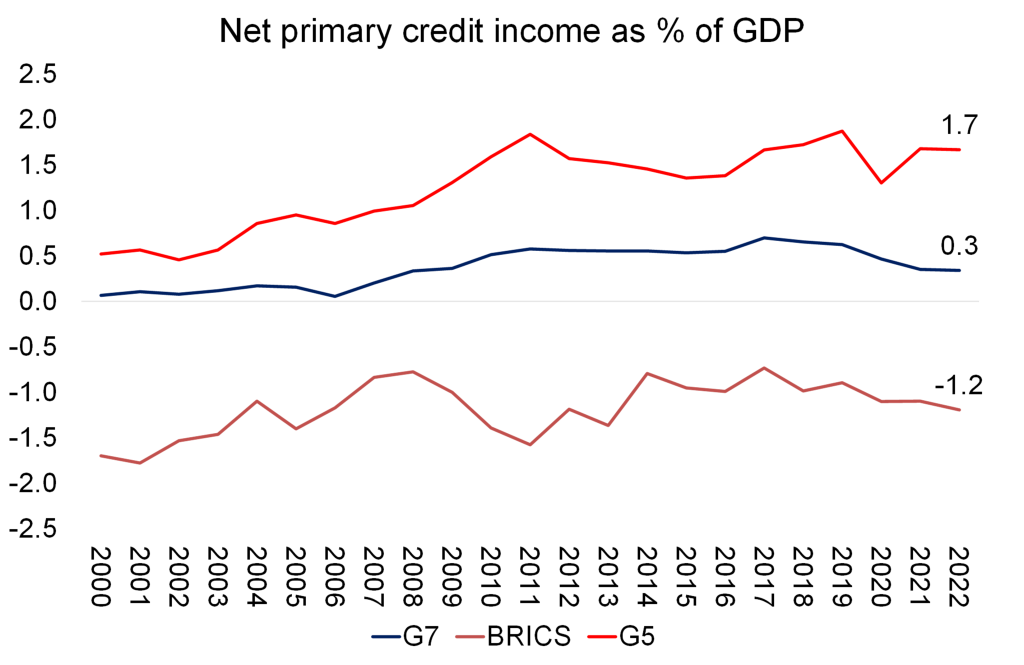
What I also found was that after accounting for the debits ie income flowing out, the NET position was even starker. The annual net flow of income to the G7 economies was around 0.5% of G7 GDP. Indeed, the top five imperialist economies (G5) obtained a staggering 1.7% of their annual GDP from such net inflows. In contrast, the BRICS economies lost 1.2% of their GDP a year in net outflows.
If you look at the net income flows for each G7 and BRICS country, the biggest gainers over the last two decades have been Japan with its huge foreign asset holdings and the UK, the rentier centre of financial circuitry. Those BRICS countries that have lost the most (as a share of their GDPs) have been South Africa and Russia.
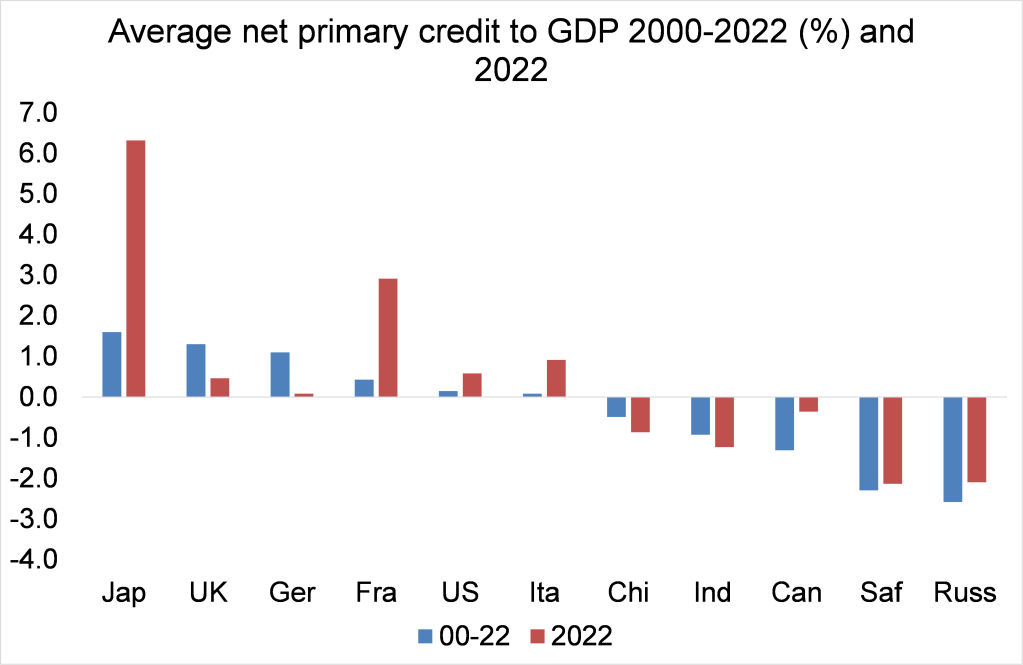
Now, if you add in the 1% of GDP gain/loss in income from international trade described above, then the imperialist bloc benefits by some 2-3% of GDP each year from exploitation of the BRICS, the major economies of the ‘Global South’ – in effect equivalent to their average annual growth in real GDP in the 21st century.
Evidence from the World Inequality Database
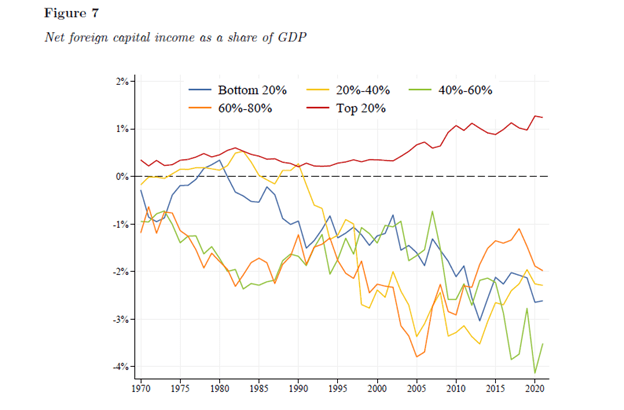
The World Inequality Database (WID), the Paris-based group of ‘inequality’ economists including Thomas Piketty and Daniel Zucman, has just published a deep analysis of what they call the ‘excess yield’ obtained by the rich imperialist bloc on assets held abroad. The WID finds that gross foreign assets and liabilities have become larger almost everywhere, but particularly in rich countries, and foreign wealth has reached around twice the size of the global GDP, or a fifth of the global wealth. The imperialist bloc controls most of this external wealth, with the top 20% richest countries capturing more than 90% of total foreign wealth. The WID also included the wealth hidden in tax havens and the capital income accrued from it.
The excess yield is defined as “the gap between returns on foreign assets and returns on foreign liabilities”. The WID finds that this has increased significantly for the top 20% richest countries since 2000. Net income transfers from the poorest to the richest is now equivalent to 1% of the GDP of top 20% countries (and 2% of GDP for top 10% countries), while deteriorating that of the bottom 80% by about 2-3% of their GDP. These results are pretty similar to the results that I got for net credit income flows above.
The imperialist bloc has remained virtually the same for over 100 years
What was striking to us in our original paper was that the imperialist bloc of countries as we defined it in 2021 was virtually the same as those advanced capitalist economies that Lenin identified as the imperialist grouping in 1915 – around 13 countries or so. There had hardly been any additions to the club – it was closed to new members. Emerging capitalist economies in the last century were condemned to domination by the imperialist bloc. This new study by the WID confirms that conclusion. Over the last 50 years in their survey, the imperialist bloc is unchanged and increasing its extraction of wealth income from the rest -and that includes the likes of China, India, Brazil and Russia. In that sense, these BRIC countries cannot be considered even sub-imperialist, let alone imperialist.
That brings me to a few thoughts on the issue of super-exploitation. Super-exploitation has been defined as where wages are so low that they are below the value of labour power, ie the amount of value necessary to keep workers functioning and reproducing sufficiently to continue to work. Workers with wages and benefit levels below that are paupers in effect. It has been argued that this is the major feature of imperialist exploitation of the Global South. Wages are so low there that they are below the value of labour power. It is super-exploitation that enables the imperialist multi-nationals to make their super profits in trade, invoicing and investment income.
In our original paper, we questioned whether ‘super-exploitation’, which no doubt exists, was necessarily the major driver of surplus value transfer from the poor countries to the rich. In our view, the mechanism of capitalist exploitation and surplus value transfer was doing the job without having to resort to super exploitation as the main cause.
There is no ‘international wage’
Moreover, international super-exploitation implied that there was some average international wage level that could act as a gauge of the value of labour power globally. But while there are international market prices for export goods and services, there is no international wage. Wages are very much determined by the balance of power between capitalists and workers in each country. Sure, there are international pressures and domestic capitalist companies in the Global South competing in world markets against much more technologically advanced companies in the imperialist bloc can often only survive by driving down wages for their workers. But that means the rate of surplus value or exploitation rises to compensate for the loss of surplus value in international trade with the imperialist companies given their more productive technologies.
Indeed, in our original paper, we found that it was a combination of the two factors: better technology lowering costs per unit for the rich economies; plus a higher rate of exploitation in the poorer countries that contributed to that 1% of GDP annual transfer of profits from the BRICS to the imperialist club. We found that it was about 60:40 for the contribution of more productive technology against higher rates of exploitation in the transfer of surplus value from the poor to rich countries.
National poverty wage levels
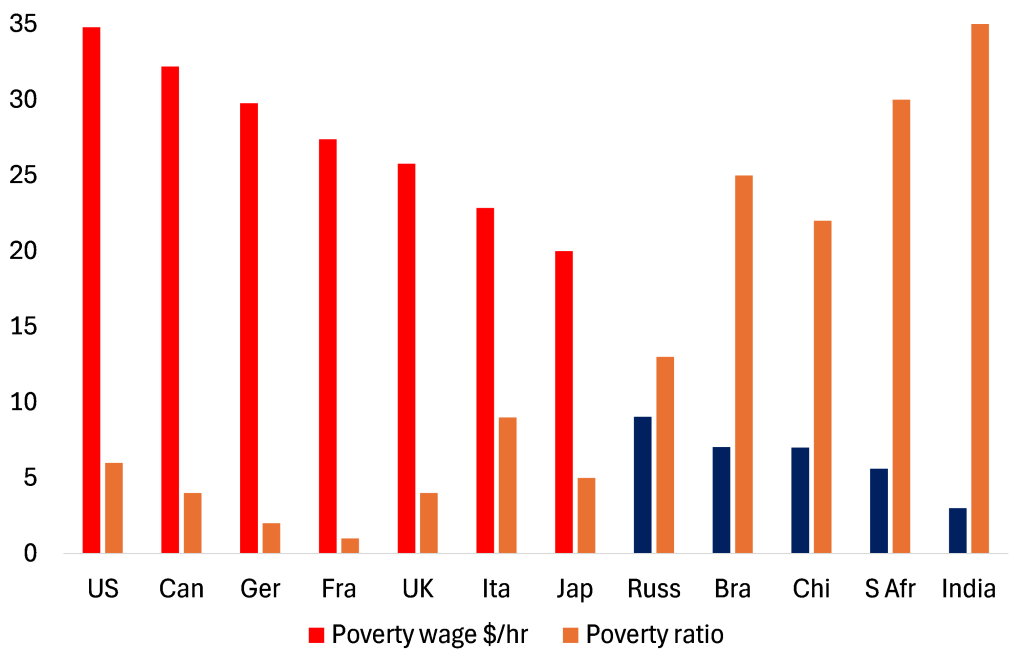
Could we measure whether the transfer of value is due to ‘super-exploitation or not? One way would be to look at national poverty wage levels. They vary sharply across countries and between rich and poor countries. If these levels can be considered the tipping point of wages above or below the value of labour power, then the percentage of workers in both rich and poor countries earning less than these national levels could be considered to be ‘super-exploited’.
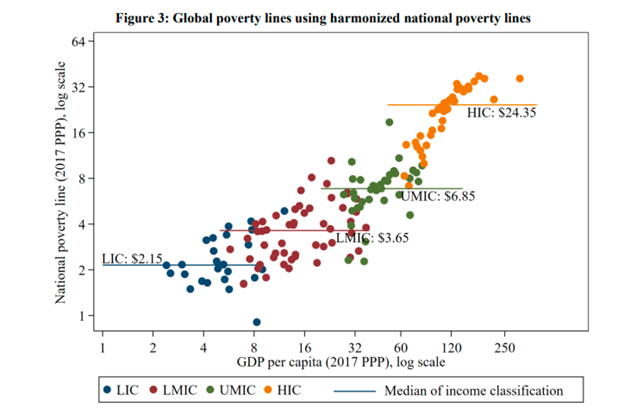
The point here is that there are also workers in the imperialist ‘rich’ economies that are ‘super-exploited’ by this criterion. And in turn, there are many workers in the poor countries that are earning above their national poverty wage levels.
Workers in the imperialist bloc are also ‘super-exploited’ using this criteria
Look at the poverty wage levels for the G7 and BRIC economies that I calculated from World Bank sources. Based on the ratio of workers earning less than the poverty wage rate in their respective countries (as provided by the World Bank), I reckon that roughly 5-10% of G7 workers are being ‘super-exploited’, while in the BRICS it’s about 25-30%. But that still means that 70% of workers in the BRICS, while earning way less per hour than G7 workers, are not earning below the value of their labour power on a national basis. Exploitation of workers in the Global South is huge, but super-exploitation as such is not the main cause.
In sum, what these new studies confirm is that imperialism can be quantified in economic terms: it is the persistent transfer of surplus value to the rich countries from the poorest countries of the world through unequal exchange in international trade and through net flows of profits, interest and rent from investments and wealth owned by the rich countries in the poor countries. This process developed some 150 years or so ago and remains.
From the blog of Michael Roberts. The original, with all charts and hyperlinks, can be found here.

