
By Michael Roberts
This blog was originally published by Michael Roberts on Saturday, 10 August 2024. The original article can be found here.
**************
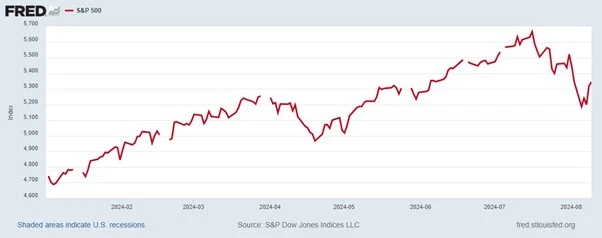
Last week’s meltdown in the stock markets of the major economies, which started in the US, reversed this week. But the fall in the US S&P-500 index of the stock prices of the top 500 American companies is still down from its peak in mid-July and from the start of the ‘meltdown’ at the end of July. So it would appear that the great upswing in US stocks since the beginning of the year, and particularly since May, is over.
What caused this turn downwards and does it herald something more serious for the US economy? Well, this is what I said in April – word for word.
“In Q1 2024, global stock markets recorded their best first-quarter performance in five years, buoyed by hopes of a soft economic landing in the US and enthusiasm about artificial intelligence. A MSCI index of worldwide stocks has gained 7.7% this year, the most since 2019, with stocks outperforming bonds by the biggest margin in any quarter since 2020.
Looking behind the quarter 1 stock market rise
“This global surge has been helped mainly by the US stock index, the S&P 500, which closed at a record high on 22 separate occasions during the last quarter. The AI hype has fuelled the market’s gains, with the major AI chip designer Nvidia adding more than $1tn in market value, equivalent to about one-fifth of the total gain for global stock markets this year! Nvidia’s market capitalisation rose by about $277bn — roughly equivalent to the market value of every listed company in the Philippines, according to HSBC.
“Euphoria in the US stock market is continuing as investors are convinced that any US economic recession is off the agenda, and instead US economic growth will accelerate this year and drive up global corporate profits. Are they right?
“Finance capitalists usually measure the value of a company by the share price divided by annual profits. If you add up all the shares issued by a company and multiply it by the share price, you get the ‘market capitalisation’ of the company — in other words what the market thinks the company is worth. This ‘market cap’ can be ten, 20, 30 or even more times annual earnings. Another way of looking at it is to say that if a company’s market cap is 20 times earnings and you bought its shares, you would have to wait for 20 years of profits to double your investment. And we can get a sort of average price of all the company shares on a stock market by using a basket of share prices from a range of companies and index it. That gives us a stock market index like the S&P-500 index for the top 500 US companies in market capitalization.
“As company stock prices are based on the subjective judgements of financial investors, they can get way out of line with the actual profits made by companies and relative to the value of the assets (machinery, plant, technology etc) that companies own. That’s the current situation.”
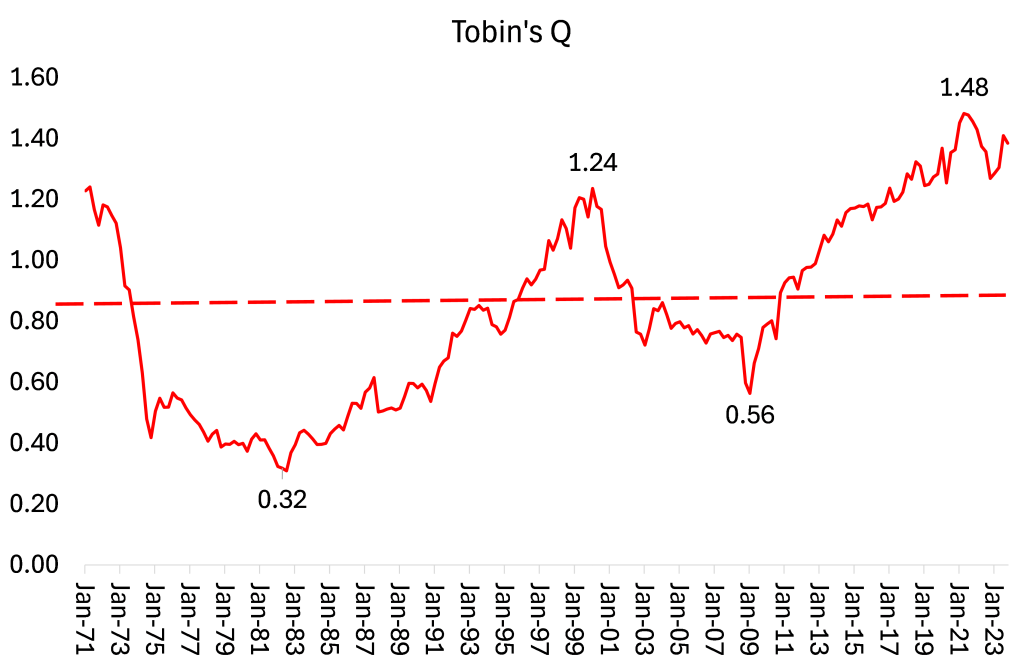
Stock markets were well above real value in quarter 1
So the US and other stock markets were suspended in mid-air, well above real value. As measured by the ratio of stock price values of the S&P-500 to the book (monetary) value of the assets of the 500 companies, i.e. Tobin’s Q was near a historic record high.
But: “Whatever the fluctuation in stock prices, eventually the value of a company must be judged by investors for its ability to make profits. A company’s stock price can get way out of line with the accumulated value of its stock of real assets or its earnings, but eventually the price will be dragged back into line.” In April, I said: “Fundamentally, if US corporate profit growth slows (and it has been) and interest rates on borrowing stay high, then the squeeze on stock prices will eventually lead to a reversal of the current market boom.”
Limited growth outside of the ‘magnificent seven’
Back then, there were already faultlines appearing in the boom (called a ‘bull market’). The S&P 500 stock index (for the top 500 US companies) was almost totally driven by the seven large social media, tech and chip companies – the so-called Magnificent Seven (Alphabet, Amazon, Apple, Meta, Microsoft, Nvidia and Tesla). The market prices of the other 493 companies in the S&P index had hardly moved relative to earnings. So the whole market index depended on the Magnificent Seven sustaining their profit gains.
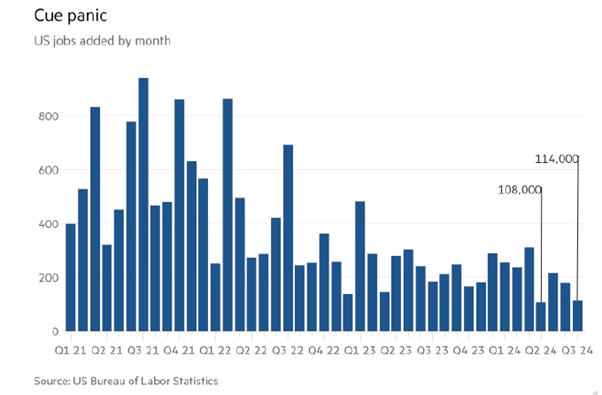
The trigger for the meltdown came when the US Federal Reserve at its end-July meeting decided not to reduce its policy interest rate because it thought inflation remained ‘sticky’. Just days later the US jobs figures for July were announced and they showed very weak growth, with net jobs up only 114k, half the previous 12 months average rise.
And the official unemployment rate rose to 4.3%, triggering the so-called Sahm rule that predicts a recession; and well above its post-pandemic low of 3.4% in April 2023. The Sahm Recession Indicator (named after Claudia Sahm, a former Federal Reserve economist) is a pretty accurate signal for the start of a recession. It is “when the three-month moving average of the national unemployment rate (U3) rises by 0.50 percentage points or more relative to its low during the previous 12 months.” And that was breached.
The factors that preceded the stock market drop
At the same time, the US manufacturing sector has remained deep in contraction territory according to the latest ISM survey of manufacturing activity, which fell to 46.6 in July from 48.5 in June. (Any score below 50 means contraction.) July’s figure was the sharpest contraction in US factory activity since November 2023 and the 20th decline in activity during the last 21 periods.
Then, as the quarterly corporate earnings results came out at the end of July, despite proclaimed good results, investors started to sell as they were worried that the huge capital spending on AI and semi-conductors planned by the Magnificent Seven would not deliver better earnings in the future. These companies have invested billions into their AI infrastructure, but investors now started to wonder about the returns on this investment. Equity investor company, Elliot management said AI is “overhyped with many applications not ready for prime time” and that uses are “never going to be cost-efficient, are never going to actually work right, will take up too much energy or will prove to be untrustworthy.” Indeed, surveys show that, so far, only 5% of firms are using AI in their operations, suggesting limited growth, or at least slow growth.
The situation was compounded by the decision of the Bank of Japan to raise its policy interest rate with the aim of boosting the value of the yen against the dollar and to control rising inflation. This weakened what is called ‘the carry trade’ in currency speculation. This is where speculators borrow lots of yen at previously zero interest rates and then buy US dollar assets (such as tech stocks). But the Bank of Japan’s action meant that the cost of borrowing in yen suddenly rose and so speculation in dollar assets fell back.
Surge in investor ‘fear’
All these factors came to a head last Friday and again on the following ‘Black Monday’. Investors panicked – as expressed by the so-called Vix index that measures investor ‘fear’.
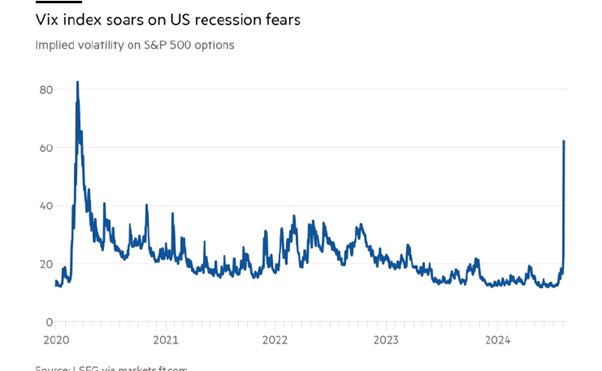
But does this meltdown mean that the US economy is going into recession? Well, since the meltdown, all the mainstream economists have rushed to assure investors that actually all is well. The FT shouted: “everyone calm down!” Evidence was presented at length that unemployment is still low, inflation will fall further and the US economy as a whole is still growing.
Profits ultimately call the tune
And it’s true that stock markets are not the ‘real’ economy. In essence, what stock market prices express are investor expectations (rational or irrational) about future profits and profitability. It’s profits that eventually call the tune. US corporate profits started to contract this time last year but since then have made a modest recovery.
So maybe this meltdown is just a ‘correction’, taking stock prices down closer to corporate earnings growth. That’s what happened in 1987 when there was an even larger stock market meltdown. Within weeks, the markets recovered to reach new highs.
Profitability figures point to a future recession
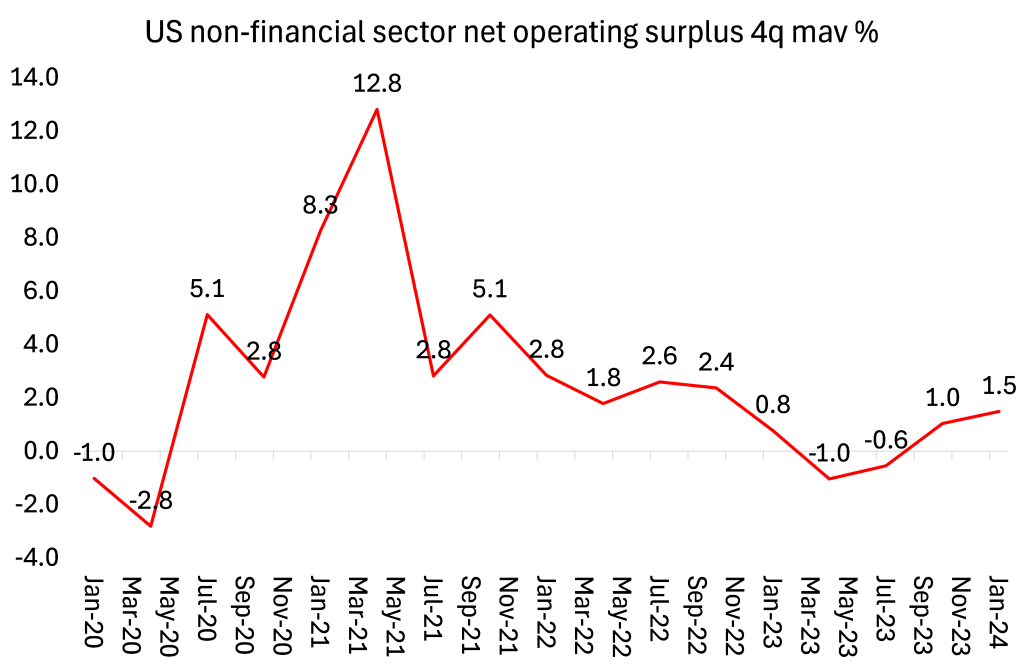
On the other hand, the profitability of non-financial sector capital (not profits as such) is at its lowest since the end of the Great Recession on 2008-9. That spells recession in the future.
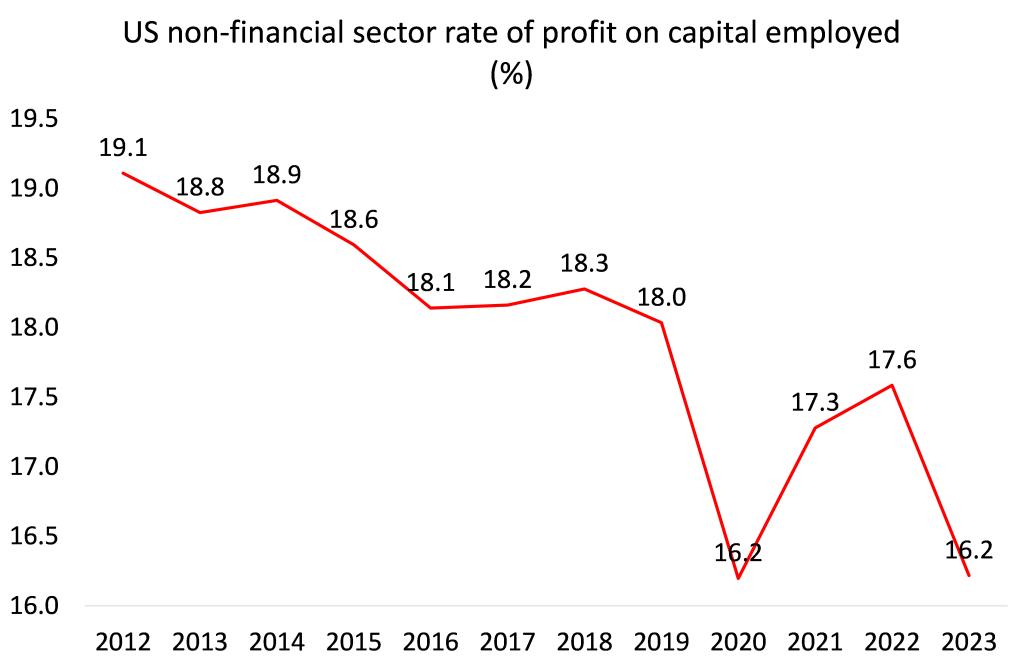
It’s not 1929, when the stock market dived and heralded the beginning of the Great Depression. US corporate profitability had already fallen over 13% from 1924. But even if this stock market meltdown does not presage a recession in real output, investment and employment right now, the current trend in profitability suggests a recession will eventually occur before this decade is out.
From the blog of Michael Roberts. The original, with all charts and hyperlinks, can be found here.

