By Michael Roberts
Empirical evidence on economic inequality has mushroomed in the last two decades. I refer here to economic inequality (income and wealth) as opposed to social inequality (life expectancy, access to health and education, levels of pollution etc), because the former drives the inequalities in the latter.
Economic inequality can be looked in several different ways. First, there is inequality of incomes earned (wages and profits); then there is inequality of net personal wealth (assets owned after debt is accounted for); then there is inequality of capital assets (the size of companies and ownership of stocks). Then there is global inequality ie the inequality of income and wealth between nations; and inequality of income and wealth within nations. Inequality is a relative measure, not an absolute one.
Inequality of incomes
Let’s take inequality of incomes first. The basic measure of income inequality is the Gini coefficient of income inequality, which captures the overall fairness of the distribution. A gini coefficient of one would mean all income received in any one year went to just one person. A coefficient of zero would mean that income was equally shared by all. All countries in the 21st century have a coefficient between these two extremes.
Recently much has been made by some mainstream economists that this coefficient has been either flat or falling for the past two decades in Britain, America and much of western Europe. The ratio between the earnings of the top and bottom 10 per cent has also flattened out; if anything, it has been falling. World Inequality Report data show that the share of national income going to the richest ten percent has increased in nearly every country from 1980. But that inequality of income appears to have flattened out since 2010.
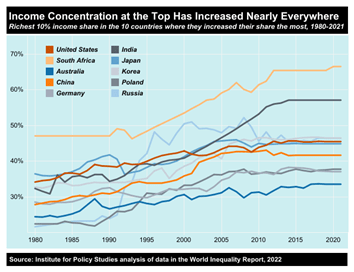
The super earners are pulling away from the middle earners
The reason is not a reversal of rising inequality; it’s because the disparity between earnings at the very top of the income scale and the middle-income groups has trended wider since the turn of the millennium, while the gap between the bottom and the middle has narrowed. The super earners are pulling away from the middle (up from 6x to 7x) and lower-income earners have reduced the gap with the middle (from 5x to 4x).
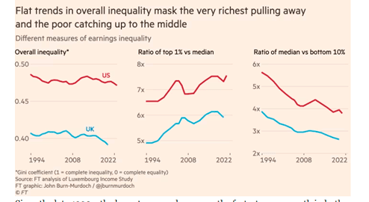
Sustained increases in the minimum wage have been a big part of this story in Britain. And in both the US and the UK, low-skilled workers have benefited (and middle-skilled workers suffered) from a ‘hollowing out’ in the middle of the jobs distribution. In the US, the highest-paying jobs are increasingly shared among a handful of ultra-high-status occupations. Tech workers now account for one in six of the top 5% of salaries, up from one in 20 in 1990. No single group had this dominance in the past.
Income inequality in all regions of the world
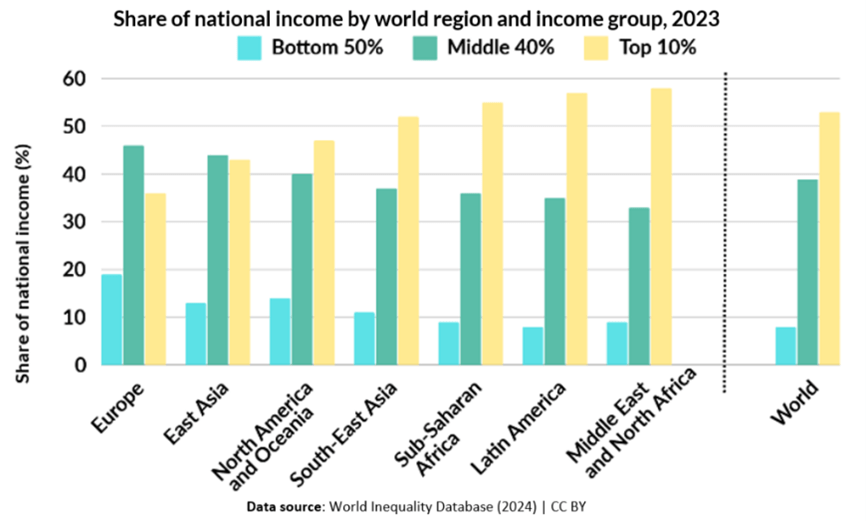
None of this does away with the clear increase in income inequality within countries that has happened nearly everywhere since the 1980s. The poorest 50% of the population consistently lags behind the top 10% of the population in every region, even though this gap is more pronounced in the Middle East, Latin America, and Africa, compared to Europe. Worldwide, the top 10% of income earners take more than 50% of all income received, while the bottom 50% take just 5%.
Within some countries, inequality has reached extreme levels. For instance, South Africa ranks as one of the most unequal countries, with the richest 10% capturing 65% of national income. Yemen also exhibits significant inequality, with the top 10% earning 59.5% of income and the top 1% alone claiming 25%.
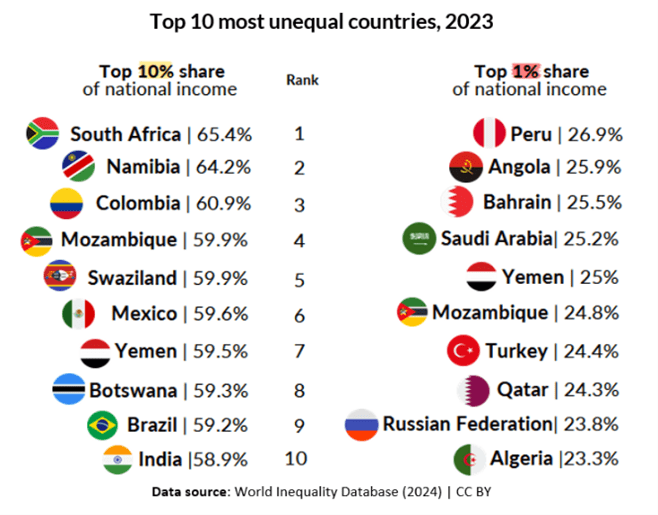
In the OECD, the US is the most unequal country in the OECD, with 21% of national income going to the richest 1% – the same as in Mexico (21%), and slightly more than in South Africa (19%).
Disparity between the global north and south
Then there is global inequality of incomes, ie the disparity between incomes for adults in poor and rich countries; and in average incomes in each country. In 2023, the global average per capita national income (including the ‘in-kind’ value of public services) stood at about €12,800 per year (PPP), or €1,065 per month. However, this figure hides huge disparities between regions. For example, the average income in Sub-Saharan Africa was just €240 per month, compared to over €3,500 in North America and Oceania, a difference of 1 to 15.
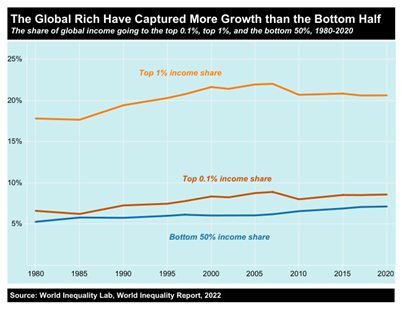
The global rich have captured more growth than the bottom half
Rapid economic growth in Asia (particularly China and India) has lifted many people out of extreme poverty. But the global richest 0.1 percent and 1 percent have reaped a much greater share of the economic gains, according to the World Inequality Report. In 2020, the richest 1 percent pocketed 20.6 percent of global income, up 2.8 percentage points since 1980. The top 0.1 percent pocketed 8.59 percent in 2020, up 1.98 percentage points since 1980. These ultra-rich individuals did take a hit in the 2008 financial crisis, but the richest top 0.1 percent have nearly regained the global income share they enjoyed in 2007.
The COVID-19 pandemic, the ensuing inflation and the rise in international conflicts have meant that global ‘extreme poverty’ rates have actually risen over the last four years. Declines in the less-extreme forms of global poverty more common in middle-income countries have continued, but at a much slower pace than during the 2010s. Unless something changes, the World Bank warns of a possible “lost decade” for ‘the war’ on global poverty.
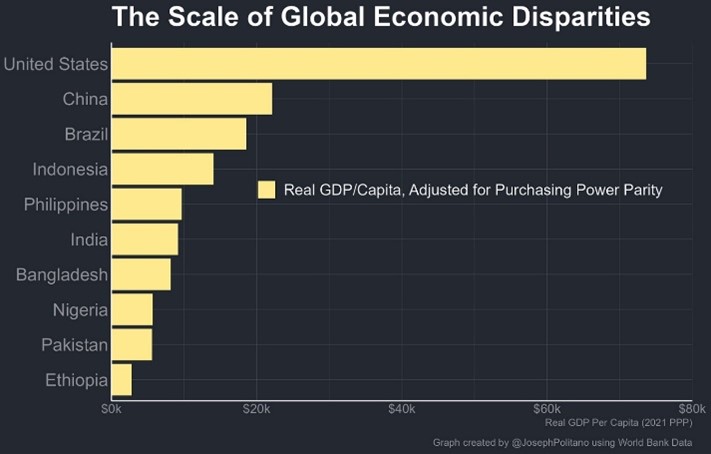
Big differences in real GDP per capita
Annual per-capita output in the US is $73k—roughly 26 times the average for the low-income countries. Even lower-middle-income countries like India, Nigeria, and the Philippines average only one-ninth of America’s economic output. That lower GDP represents less consumption of food, healthcare, and technology, less investment in infrastructure, education, and housing, and less general welfare for billions of people across the globe.
Inequality of wealth even greater than inequality of incomes
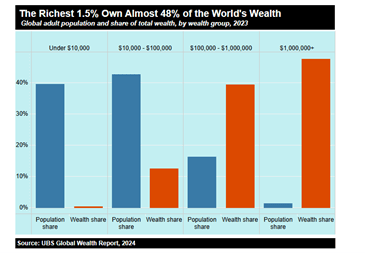
Inequality of incomes both between countries and within countries pales into comparison with inequality of wealth. As I have reported before, the latest UBS Global Wealth Report shows that the top 1.5% of personal wealth holders take around 48% of all global personal wealth, while the bottom 40% of the world’s population own nothing (after debts).
Tiny group of ultra-wealthy individuals
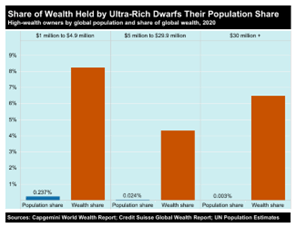
“Ultra high net worth individuals” — the wealth management industry’s term for people worth more than $30 million — hold an astoundingly disproportionate share of global wealth. These wealth owners held 6.5 percent of total global wealth, yet represent only a tiny fraction (0.003%) of the world population.
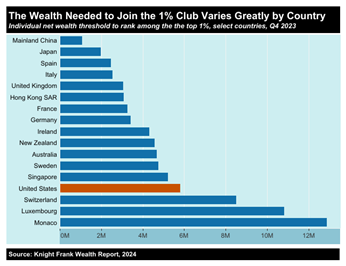
While wealth concentration is increasing in nearly every country, it takes significantly more wealth to rank among the top 1% in different countries. According to the Knight Frank Wealth Report, in the US, you need to be sitting on at least $5.8 million to join this elite club. That’s 5.4 times as much as the minimum needed to be in the top 1% in China, the second largest economy and 1.5 times as much as in Germany, the third-largest economy.
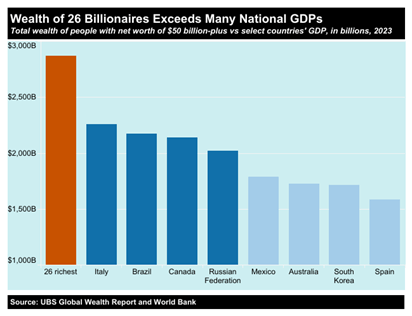
The world’s 26 richest billionaires, according to the latest UBS Global Wealth Report, owned an astonishing $2.872 trillion in wealth, as of 2023. This combined wealth is greater than the total goods and services most nations produce on an annual basis, according to World Bank GDP data.
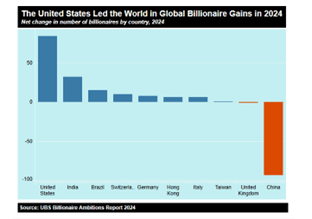
Number of billionaires grows the fastest in the US in 2024
Compared to other countries, the US saw the largest expansion of its billionaire class in 2024, according to the UBS Billionaire Ambitions Report. By the Switzerland-based investment bank’s count, the number of American billionaires rose from 751 in 2023 to 835 in 2024. By contrast, China’s nine-digit club shrunk from 520 to 427 as a real estate crisis and financial market turmoil pushed many newly minted members below the $1 billion mark.
OECD statistics show that the top 1 percent in the US holds 40.5 percent of national wealth, a far greater share than in other OECD countries. In no other industrial nation does the richest 1 percent own more than 27 percent of their country’s wealth.
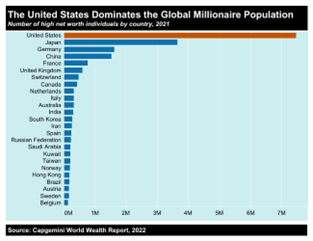
China has had rapid growth in this top wealth tier. But while that country has more than four times as many people as the US, the number of high net-worth Americans is 4.8 times greater than the number in China.
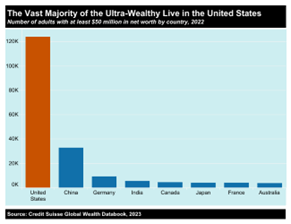
Elon Musk’s wealth in stacked $100 bills would reach 330 miles above the ground
It’s almost impossible to grasp the magnitude of US wealth inequality. Think of it this way: $100,000 saved for retirement is a 4.3-inch stack of $100 bills; $1M is 43 inches; and $1billion is 3,600 feet ie 12 football fields (the world’s tallest building is 2,722 feet). Yet Elon Musk has $486bn; that’s 330 miles high or 60 Mt. Everests stacked!
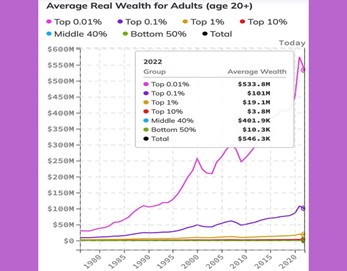
Inequality of wealth no better in the Nordic countries
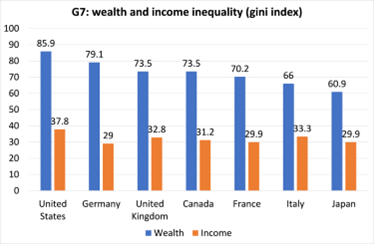
And when you use the gini index for both income and wealth for each country, the difference is staggering. Take a few examples. The gini index for the US is 37.8 for income distribution (pretty high), but the gini index for wealth distribution is 85.9! Or take supposedly egalitarian Scandinavia. The gini index for income in Norway is just 24.9, but the wealth gini is 80.5! It’s the same story in the other Nordic countries. The Nordic countries may have lower than average inequality of income but they have higher than average inequality of wealth.
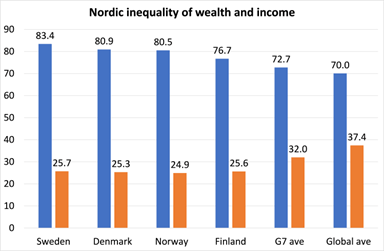
Which countries have the worst inequality in personal wealth? Here are the top ten most unequal societies in the world.
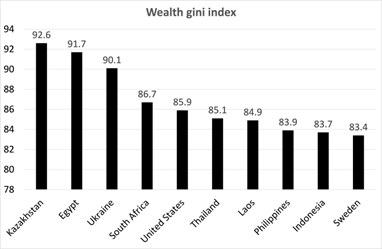
You might expect to find some of these countries listed here in the top ten: ie very poor or ruled by dictators or the military. But the top ten also includes the US and Sweden. So both a ‘neoliberal’ advanced economy and a ‘social democratic’ economy make the list: capitalism does not discriminate when it comes to wealth.
Nevertheless, the US stands out as leader in the top G7 advanced economies in wealth and income inequality.
Indeed, can we discern whether high inequality in wealth is closely correlated with inequality in incomes? Using the WEF index, I found that there was a positive correlation of about 0.38 across the data: so the higher the inequality of personal wealth in an economy, the more likely that the inequality of income will be higher.
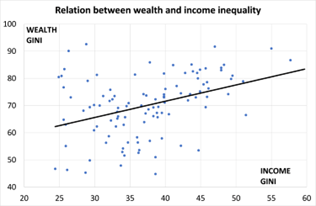
The question is which drives which? This is easily answered. Wealth begets wealth. And more wealth begets more income. A very small elite owns the means of production and finance and that is how they usurp the lion’s share and more of the wealth and income.
Another important aspect of wealth inequality is that is mainly achieved by inheritance through generations. Donald Trump became a billionaire because his father was already near being one; Elon Musk got going with millions in support from his father. The American dream of rags to riches through hard work and entrepreneurial skills is just that a dream, not reality.
Family inheritance and wealth
And a study by two economists at the Bank of Italy found that the wealthiest families in Florence today are descended from the wealthiest families of Florence nearly 600 years ago! So the same families are still at the top of the wealth pile starting from the rise of merchant capitalism in the city states of Italy through the expansion of industrial capitalism and now in the world of finance capital.
And talking of the shockingly high inequality of wealth in ‘egalitarian’ Sweden, new research from there reveals that good genes don’t make you a success but family money, or marrying into it, does. People are not rich because they are smarter or better educated. It is because they are either ‘lucky’ and/or inherited their wealth from their parents or relatives (like Donald Trump). Researchers found that “wealth is highly correlated between parents and their children” and “Comparing the net wealth of adopted and biological parents and that of the adopted child, we find that, even prior to any inheritance, there is a substantial role for environment and a much smaller role for pre-birth factors.” The researchers concluded that “wealth transmission is not primarily because children from wealthier families are inherently more talented or more able but that, even in relatively egalitarian Sweden, wealth begets wealth.”
Wealth concentration derives from ownership of productive capital
But as I have argued before, wealth concentration is really about the ownership of productive capital, the means of production and finance. It’s big capital (finance and business) that controls the investment, employment and financial decisions of the world. A dominant core of 147 firms through interlocking stakes in others together control 40% of the wealth in the global network according to the Swiss Institute of Technology. A total of 737 companies control 80% of it all. This is the inequality that matters for the functioning of capitalism – the concentrated power of capital. And because inequality of wealth stems from the concentration of the means of production and finance in the hands of a few; and because that ownership structure remains untouched, any increased taxes on wealth will always fall short of irreversibly changing the distribution of wealth and income in modern societies.
The power of capital also exerts itself internationally between nations. Excluding countries with a population of less than 10 million, the ten richest countries all receive positive net foreign income on their capital. In contrast, the world’s ten poorest countries are former colonies, most located in Sub-Saharan Africa. They display the opposite trends compared to the richest. Most of these countries pay significant net foreign income to the rest of the world. In other words, these countries are sending out more money than they are receiving from foreign investments. This drain limits their capacity to invest in areas such as infrastructure, healthcare, and education – key to lifting them out of poverty. No wonder they can never ‘catch up’ and close the gap with the Global North.
Disparity in the causes of climate change and its impact
Another of the by-products of this grotesque level of income and wealth concentration is that the poorest 50 percent of the world population is responsible for just 12 percent of global carbon emissions, but is exposed to 75 percent of income losses (relative to what incomes would be in a world without climate change).
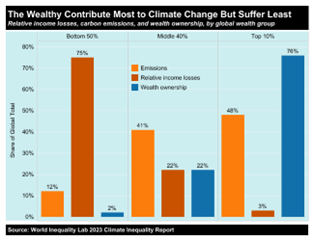
By contrast, the world’s richest 10 percent accounts for close to half of all emissions, but faces just 3 percent of relative income losses, according to analysis by World Inequality Lab. Thus we have a clear example of how economic inequality breeds social inequality and takes the bulk of humanity and nature close to the brink.
From the blog of Michael Roberts. The original, with all charts and hyperlinks, can be found here.


