By Michael Roberts
The first estimate of third quarter real GDP growth in the US was released yesterday (Thursday 26 October). It showed the US economy expanded by an annualised rate of 4.9%. The Financial Times called this a “blistering pace that, not for the first time, defied gloomier predictions from economists.” US Treasury Secretary Janet Yellen commented that “It’s a good, strong number and it shows an economy that’s doing very well,” and she is “not expecting growth at that pace to continue, but we do have good, solid growth.”
The doomsayers (like me?) have been proved wrong. The consensus is now that is very likely that the US economy would see inflation drop back to pre-pandemic levels without having to go into a slump and so suffer any significant rise in unemployment – in other words, a ‘soft landing’. And assuming that this first estimate of Q3 growth is not significantly reduced in the second estimate in a few weeks, then it seems that the US economy will avoid a slump this year.
The 1.2% growth in Q3 – where did it come from?
But there are some caveats. The headline growth rate of 4.9% is an annualised figure i.e, quarterly real GDP growth in Q3 was actually 1.2% up over Q2, but the US statisticians multiply that by four to get an ‘annualised rate’. No other major economy’s stats are presented in this way. Even so, it is still a relatively strong figure and certainly likely to be faster than any other G7 economy. The rise over Q3 2022 (ie one year ago) was 2.9% – still higher than elsewhere, but not so startling as the annualised figure.
Where is this growth coming from? Most of the faster growth in Q3 came from 1) higher consumer spending on health, utilities and durable goods 2) a rise in stocks of inventories and 3) from a sharp rise in government spending.
Consumer spending has run down ‘excess savings’
American households have continued to spend more. That’s partly because unemployment is low and Americans are getting wages from work. As the inflation rate has fallen back, for the first time in two years, real wages have now started to rise. Americans are also using savings built up during the pandemic lockdowns to sustain spending. But these ‘excess savings’ have now been run down.
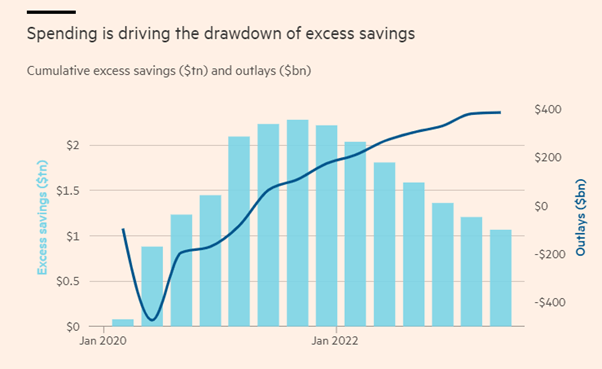
As a result, households are running up debts (credit cards etc) to sustain spending.
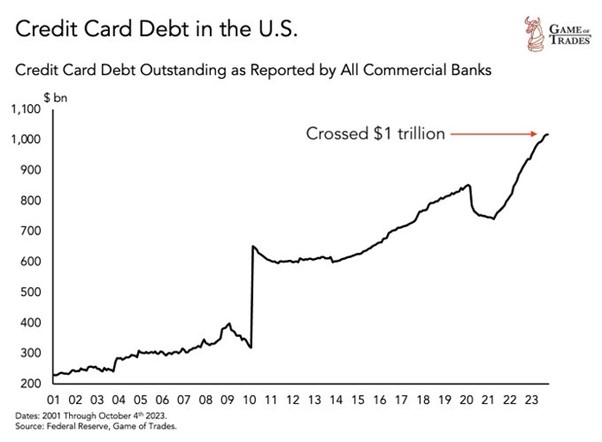
So it is unlikely that the US consumer will contribute as much to future US real GDP growth.
Then there are inventories or the stock of unsold goods. In the Q3 growth figure, inventories contributed 1.3% pts of that 4.9% headline rate. That tells you that even though the US consumer is still buying more, unsold sales are building up and companies will have to slow production in future to run down existing stocks.
Increased Government spending on arms and military activities
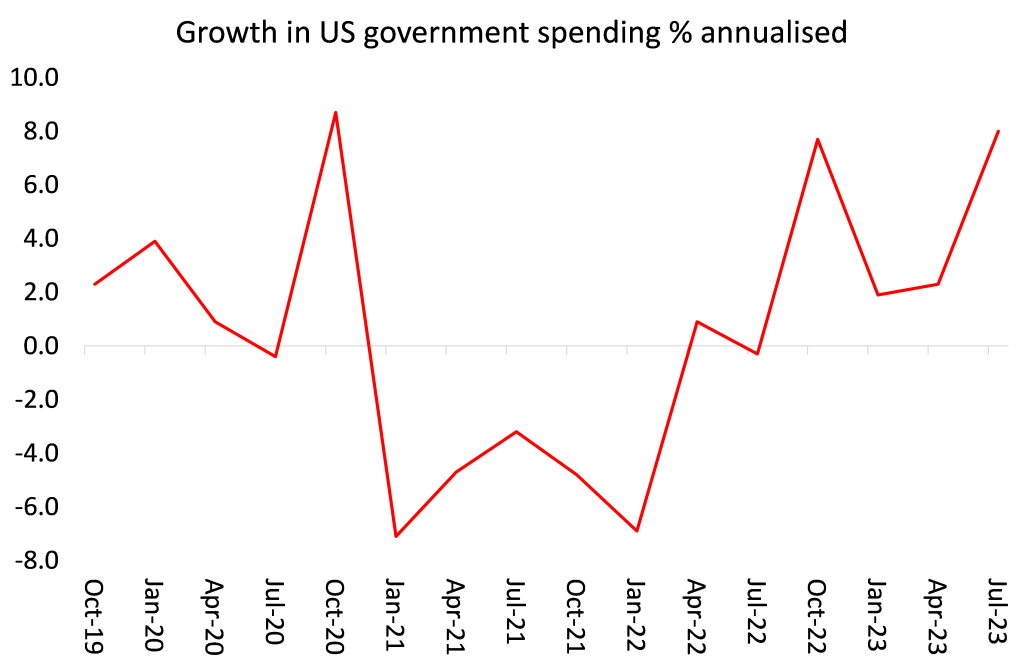
Another large contributor to Q3 growth was government spending and investment, some 0.8% pts of that 4.9%. In previous quarters, this spending increase was for infrastructure. But in Q3, there was a very sharp increase in spending on arms and other military activities.
If we just look at the core drivers of economic growth in a capitalist economy ie consumption and investment, then the annualised growth rate is much less than 4.9% – or 2.5% annualised.
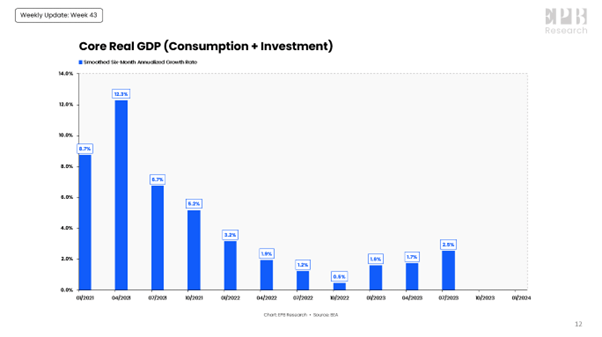
Those core drivers did pick up a bit in Q3, but is that likely to continue in Q4 and into 2024? Well, personal consumption growth is likely to slow as ‘excess savings’ disappear and rising interest rates on loans and credit cards force households to reduce borrowing. And that applies even more to business investment, the productive part of investment.
Business investment growth now at a standstill
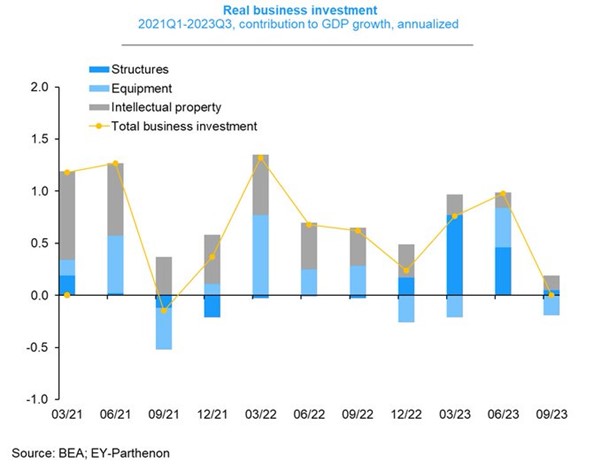
Changes in business investment have always been an indicator of future growth in output and employment – not vice versa, as Keynesians argue. And in Q3, business investment came to a standstill. In previous quarters it was investment in new structures (offices, manufacturing plants etc) that kept business investment contributing about 1% pt to quarterly growth. But in Q3 that has evaporated.
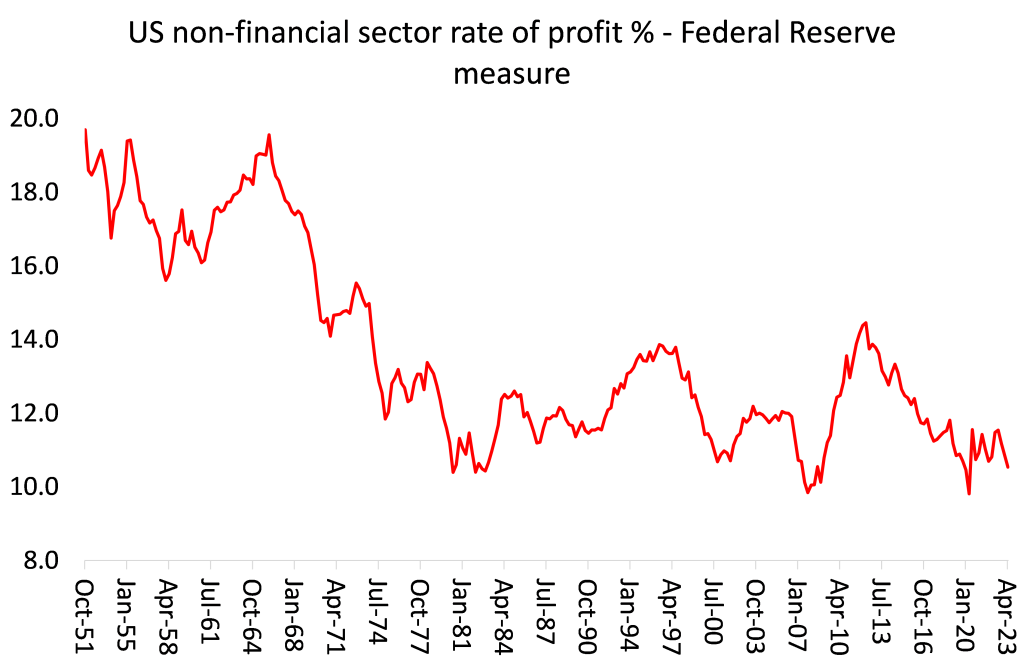
Why? Two reasons. First, the profitability of investing in productive sectors of the economy, unless subsidised by government tax handouts etc, is very low. So there is no incentive to invest.
And second, rising interest rates caused by the Fed hiking its policy rate, supposedly to control inflation, has increased borrowing costs to levels not seen since the 1970s. Indeed, Goldman Sachs point out that the number of unprofitable firms reached almost 50% of all publicly-listed companies in 2022. The share of business activity that they account for is much smaller, but still an economically meaningful 10% of total business revenues and 13% of capital spending and employment. GS comments that “higher funding costs could force some of these companies to cut labor costs or even close. Unprofitable firms tend to cut capital spending more aggressively when faced with margin pressure, and we find they also cut labor costs more aggressively when hit with interest rate shocks.”
Other indicators of a slowdown
So if personal consumption growth is set to slow into 2024 and business investment to fall absolutely, then this Q3 data will be the last good news for the US economy. And as I showed in my September post, A soft landing?, there are other signs of slowdown. Job vacancies are declining; an increase in hours worked by those in work has slowed to a trickle. Most forecasters now expect US GDP growth to fall to an annualised 0.8% next quarter and then down to 0.2% growth in Q1 2024.
Moreover, the consensus may be for a soft landing in the US, but globally that is not so. A reliable high frequency guide to current economic activity is the so-called purchasing managers’ index (PMI) – surveys of companies’ sales, orders and employment. The composite PMI shows the level of activity in both manufacturing and service sectors. Anything above 50 means expansion; anything below means contraction. The latest October PMIs show that the world economy is teetering on recession, with only the US, India, China (and the war economy of Russia) still expanding. Nearly every other major economy is contracting on this measure in October.
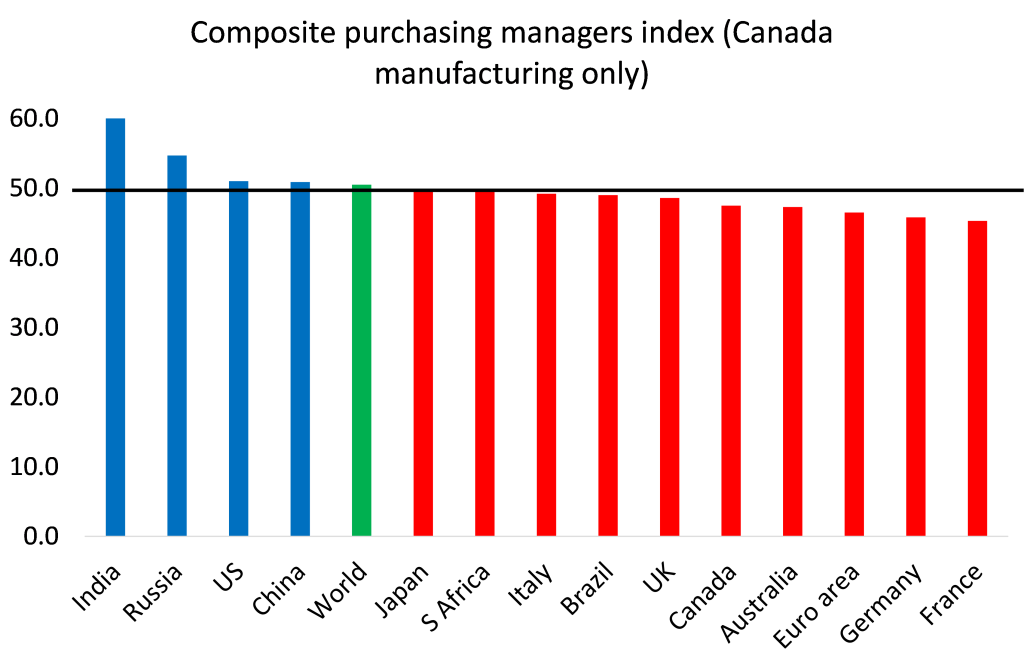
The US may have been expanding in Q3, but most of the rest of the world was contracting; and in 2024, they may be joined by the US.
From the blog of Michael Roberts. The original, with all charts and hyperlinks, can be found here.

