By Michael Roberts
This post was first published in the Spanish online journal Sin Permiso and is in response to a critique of my long depression theory presented in my book, The Long Depression.
Rolando Astarita, the excellent Argentine Marxist economist, has written a brief critique of my concept of the Long Depression, first developed in my 2016 book of the same name. Rolando begins by referring to my brief review of a recent new book by José Tapia. In my review, Rolando notes that I defend Engels’ characterization of the period 1873-1890 as a “long depressive phase of capitalism.” Rolando quotes me: “Engels wrote of ‘a permanent and chronic depression’ in 1886, right at the depth of the long 19th-century depression that engulfed the major economies around 1873-95. Engels was surely right to characterise that period as somewhat different from the earlier boom period of 1850-73, which also had, however, a succession of crises.”
Rolando questions this characterization because, he says, “the data do not show that the quarter century after the 1873 crisis was one of stagnation. In fact, the period 1873-1894, which proponents of the Kondratiev long wave thesis define as a depressive phase B, does not show growth rates so different from the previous 25 years, nor from the 25 years after.” To defend this point, he refers to the data presented by Edwards, Gordon and Reich (below).
1) Growth rate 1846–1878:
US 4.2%; Britain 2.2%; Germany 2.5%; France 1.3%. Weighted average 2.8%.
2) Growth rate 1878–1894:
US 3.7 %; Britain 1.7%; Germany 2.3%; France 0.9%. Weighted average 2.6%.
3) Growth rate 1894–1914:
US 3.8%; Britain 2.1%; Germany 2.5%; France 1.5%. Weighted average 3%.
Source: Segmented Labor, Divided Workers, Gordon, Edwards, and Reich, p. 66.
Need to analyse the period defined as the depression (1873-97)
The first thing that strikes me about these data is that there is actually a smaller growth rate between 1878-94 and the periods before and after. But it is not by much. This is because these data do not provide an accurate guide to the growth rate in the period defined as the depression. In my book (Chapter 2), I define that period as 1873-97 (at the latest). The earlier data are superimposed across that period.
I analyzed the real GDP growth rate of the United Kingdom, the largest economy in that period. I used the Bank of England’s historical series. I found the following:
Average
1851-73 2.72
1873-97 1.72
1873-86 1.28
1897-1913 1.96
1887-1913 2.09
https://www.bankofengland.co.uk/statistics/research-datasets
The average annual growth rate for the UK in the defined period was therefore 1.7% per annum, compared with 2.7% before and around 2% after. In my view the period of depression varied for different economies at the time, and in the case of the UK the depression was really from 1873 to 1886. During that period the growth rate was just 1.3% per annum, less than half the rate of the earlier period and just 60% of the rate of the later period up to the First World War. This indicates a significant slowdown which is consistent with my characterisation (and that of Engels in 1886) of a prolonged depression.
Slowdown in US growth in the defined period
Rolando points out that the United States had a much higher growth rate between 1846 and 1914 than other major economies. Sure, but when we look at the defined period of the depression, we also find a significant slowdown in US growth in the defined period. In my book, I reproduce US BEA data on US per capita income growth and it reveals a significant slowdown and even stagnation in per capita income growth between 1883 and 1896.
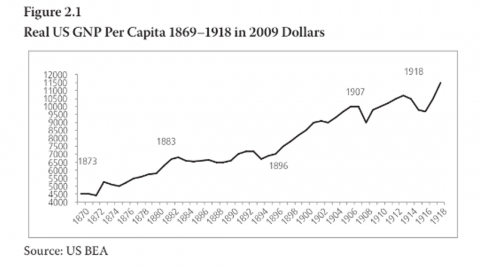
Using Maddison as a source, I found that average annual growth in per capita income in the United States slowed from 1.6% in the 1870s to 1.3% for 13 years, from 1883 to 1896, before accelerating to 1.9% per year until World War I. Once again, this confirms a 13-plus-year depressive period for the United States.
Average
1871-82 1.61%
1883-96 1.29%
1897-1913 1.92%
https://socialdemocracy21stcentury.blogspot.com/2012/09/us-real-per-capita…
The US National Bureau of Economic Research provides a wealth of data on the economic history of the United States. They produce decadal growth rates for the period in question. Between 1879 and 1893, the decadal real GDP growth rate was just 36%, compared with 65% between 1869-78 and 49% after 1893. On a per capita basis (no small feat in a country with significant immigration at the time), the decadal per capita growth rate was just 9-13% between 1879-93, less than half the rate before and after.
Decennial growth rates
GDP per capita
1848-58 70 25
1869-78 65 31
1879-83 36 9
1884-93 36 13
1894-1903 49 23
NBER
In my book, I also show a significant slowdown in the growth of industrial output during the defined depression period in all major economies. Average German industrial output growth between 1873 and 1890 was 33% lower than before 1873 and 30% lower than between 1890 and 1914. Average UK industrial output growth was 45% lower than before and 15% lower than after. Average US industrial output growth was 25% lower than before and 12% lower than after. Average French industrial output growth was 24% lower than before and 52% lower than after.
Why Rolando denies the ‘so-called Great Depression of the 19th century’
As for the causes of the late 19th century depression, Rolando believes that the “so-called Great Depression of the 19th century” was not such a thing because “it was a period of high productivity growth and the gold standard.” He goes on to say that “this would have caused permanent deflationary pressures in the economy. Hence the persistent feeling of a “bad business” climate. But productivity and production gains were a fact.”
Here Rolando repeats the views of the then and later “deniers,” who come mainly from the Austrian School, who like to claim that price deflation was due to exchange rates and money supply being controlled by the gold standard. For the “deniers,” the depression was simply a subjective feeling, not a reality. But this view was vigorously rejected by others at the time and since. In my book, I make extensive reference to the work of the great economic historian Arthur Lewis, whose careful study makes a powerful argument for defining this period as a depression (pp. 38-39).
Arthur Lewis defines the period as a depression
Lewis argues that there were several recessions during the long depression and that they were markedly worse after 1873. Lewis estimated the depth of these recessions by the time it took for output to return to a level of growth “in excess of the previous peak.” He found that between 1853 and 1873, it took about three or four years. But between 1873 and 1899, it took six to seven years. He also measured the loss of output in the recessions—that is, the difference between actual output and what it would have been if trend growth had continued. The loss of potential output was only 1.5 percent between 1853 and 1873 because “the recessions were short and mild.” From 1873 to 1883, the loss was 4.4 percent; from 1883 to 1899, 6.8 percent; and from 1899 to 1913, 5.3 percent, because “after 1873 the recessions became quite violent and prolonged.” The recessions were longer because Britain (among other countries) was in the grip of a long depression. So the original crisis (or financial panic) of 1873 was followed a few years later by another recession (1876) and another (1889) and another (1892). The loss was therefore two or three times greater in the recessions during the long depression.
Furthermore, Lewis argued that the cause of the depression (at least for the UK) was not the gold standard and the price deflation created by high productivity, but a fall in the profitability of capital. Lewis: “In the low level of profits in the last quarter of the century we have an explanation which is sufficiently powerful to account for the retardation of industrial growth in the 1880s and 1890s.”
Lewis sums up the Long Depression as follows: “There was a decline in aggregate industrial demand in the last quarter of the nineteenth century after the great boom which ended in 1873… the remarkable severity and prolongation of the Minstrel recessions. No Minstrel recession was equally severe in all countries; different countries prospered in different decades, depending mainly on the timing of the building booms. They therefore offset each other to some extent. But the net effect on aggregate industrial output was weakness from 1873 to 1899 compared with the Minstrel cycles before and after.”
The importance of profitability
Let me be clear here. I define a depression not as an actual long-term decline in output or investment, but when economies, after a recession, start to grow well below their previous rate of output (in total and per capita) and below their previous long-term average. Productive investment growth will also be below the previous long-term average. But, above all, the profitability of the capitalist sectors in the economies will be below the levels before the onset of the depression.
The debate turns to the current depression
Rolando now brings us to the period from 2000 to the present, which (at least since 2008) I define as another long depression like that of the late 19th century and the 1930s. Rolando refers to IMF data on global growth for the period 2010-24. “Taking IMF data, over the past 15 years the world economy grew at an average annual rate of 3.4%.”
2010: 5.4%; 2011: 4.2%; 2012: 3.5%; 2013: 3.4%; 2014: 3.6%; 2015: 3.5%; 2016: 3.3%; 2017: 3.8%; 2018: 3.6%; 2019: 2.8%; 2020: -2.7%; 2021: 6.5%; 2022: 3.5%; 2023: 3.2%; 2024: 3.3%
Rolando concludes that “I do not see these figures as typical of a period of ‘long depression’. The average rate was 3.39%, much higher, for example, than the average growth of the British economy throughout the 19th century (which no Marxist would hesitate to describe as a development of the productive forces).”
But comparing the growth rate of the global economy from 2010 to 2024 with the average growth rate of the UK over a hundred years in the 19th century is not comparing apples to apples. Instead, let us look at data from the IMF and the World Bank for the relevant periods from 1980 to the present.

Looking at the figures for the advanced capitalist economies
Global real GDP growth rose at a rate of 3.1-3.2% in the 1980s and 1990s, and accelerated to 3.7-3.8% in the first two decades of the 21st century. This would seem to support Rolando’s critique. But if one looks only at advanced capitalist economies, a different story emerges. In the 1980s and 1990s, average growth in AEs was 2.8-3.1%. But that rate fell to about 1.8-2.1% in the first two decades of the 21st century, a decline of about one-third of the previous average rate. In the 2020s, growth rates have plummeted even further (in the case of AEs, to half the rate of the 1980s and 1990s).
And this is IMF data. The World Bank data (lines 3 and 4) show that the average global growth rate fell from 4% per year in the 1990s to just 2.8% in the 2010s. Moreover, I would argue that the growth rate of the global economy only remained high because of the rapid growth of China, which absorbed most of the growth in the 21st century. If you exclude China (which I would do because I believe its economy does not function in the same way as the major capitalist economies and it did not experience a single recession during the 1980-2023 period), then the average global growth rate falls to just 2.5% per year in the 2010s, or 40% below that of 1990.
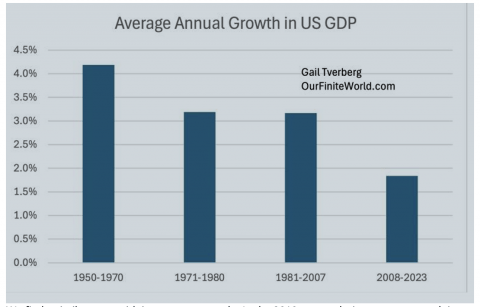
US growth rate has fallen by more than 40%
In fact, if we look at the largest economy of the late 20th and 21st centuries, namely the United States, we can see that the average US growth rate over the past 15 years has fallen by more than 40% compared to the previous 25 years.
We find a similar story with investment growth. Since the 2010s, investment growth in the world and in advanced economies (AEs) has slowed.

(US data includes China, which has the highest investment rate in the world.)
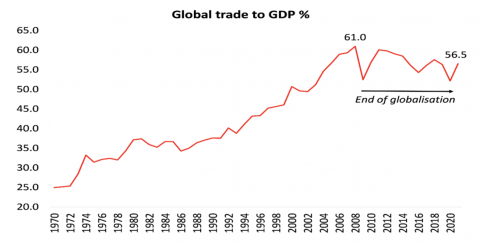
And with world trade:

To the point that we can talk about the end of globalization in the Great Depression.
Questions about the profitability of capital
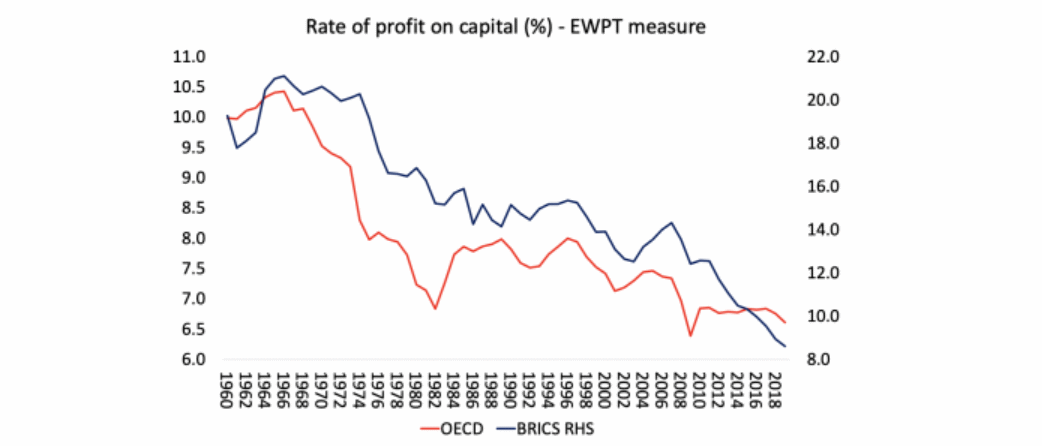
Rolando says that “I have serious doubts about the passage that Roberts continues with: ‘Yet profitability eventually resumed its secular decline beginning in the late twentieth century, a period I call the Long Depression.’” Rolando does not see any decline in the profitability of capital leading up to the Great Recession in 2008-9. Well, there are various estimates of global returns on capital, but let’s take the ROP data from the Basu-Wasner database based on Adalmir Marquetti’s Expanded Penn World Tables (EPWT).
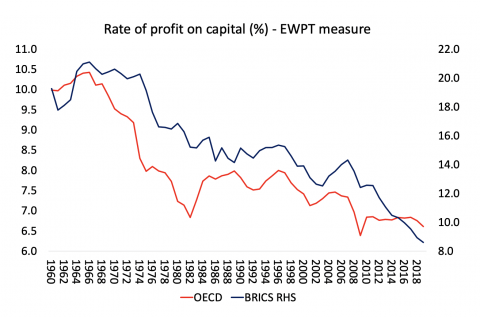
According to these figures, the rise in profitability during the so-called neoliberal period of the early 1980s peaked in the late 1990s and fell in the two years leading up to the Great Recession, remaining stagnant in the OECD and falling further in the BRICS.
The current long depression
So, in summary, the current long depression is characterized by: lower growth rates; lower investment growth rates; lower trade growth rates; and lower profit rates. Moreover, the recovery from each recession has been weaker than before, with no return to previous trend growth, as happened in the late 19th century depression (a la Lewis).
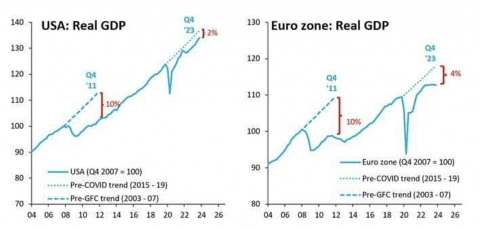
The World Bank now sees the global economy on track for its worst half-decade of growth in 30 years. Similarly, global trade growth in 2024 is expected to be only half the average of the decade before the pandemic. I think all of this provides evidence to support the definition of a depression, both in the late 19th century and now.
From the blog of Michael Roberts. The original, with all charts and hyperlinks, can be found here.

