By Michael Roberts
Next week US president Joe Biden finishes his term of office, to be replaced by the Donald. Biden would have been extremely popular with the American public and probably would have run and got a second term as president, if US real GDP had increased by 4.5-5.0% in 2024, and if during the whole of his period of office since end 2020, real GDP had risen 23%; and if per American, real GDP had risen 26% over those four years. And he would have been congratulated if the Covid death rate during the 2020-21 pandemic had been one of the lowest in the world, and the economy avoided the pandemic slump in production.
Comparison of US economic indicators with those of China
Above all, he would have been feted if the inflation of prices in goods and services after he came into office was just 3.6% in total over four years. That would have meant that, with wages rising at 4-5% a year, real incomes for average American households would have risen significantly. At the same time, strong growth would have allowed the financing of important new infrastructure spending in the US that could have led to an extensive rail network across the country using super fast trains; and with bridges and roads that did not collapse or crumble along with environmental projects to protect people and homes from fires and floods, and the introduction of cheap electric vehicles and renewables. How Biden would have been popular.
And with extra revenue from strong growth, the Biden administration would have been able to balance the government budget and curb or reduce government debt. And with zero to low inflation, interest rates on borrowing would have been near historic lows, enabling households and companies to afford mortgages and finance investment in new technologies.
And what if US companies had sold a record level of exports of goods and services to the rest of the world, running up a sizeable surplus on trade, despite various tariffs and sanctions against American companies from other trading nations. In running trade surpluses, American banks and companies would have been able to build up foreign exchange reserves and invest in projects abroad, strengthening America’s influence in the world in a beneficial way.
China outstrips the US in GDP growth in the last four years
Unfortunately, none of these things happened to the US economy in the four years of Biden’s presidency. Instead these were features of China’s economy. In 2024, China’s real GDP rose about 4.5%, while the US was up 2.7% (faster than anywhere else in the top G7 economies, but still only 60% of China’s growth rate). And throughout Biden’s term, China growth rate outstripped the US.
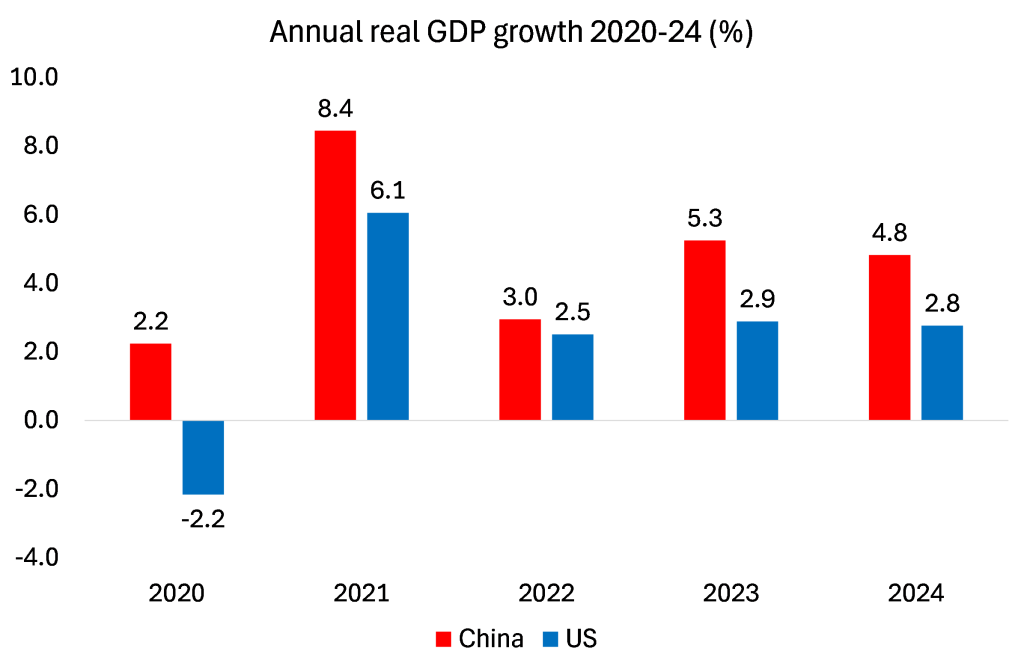
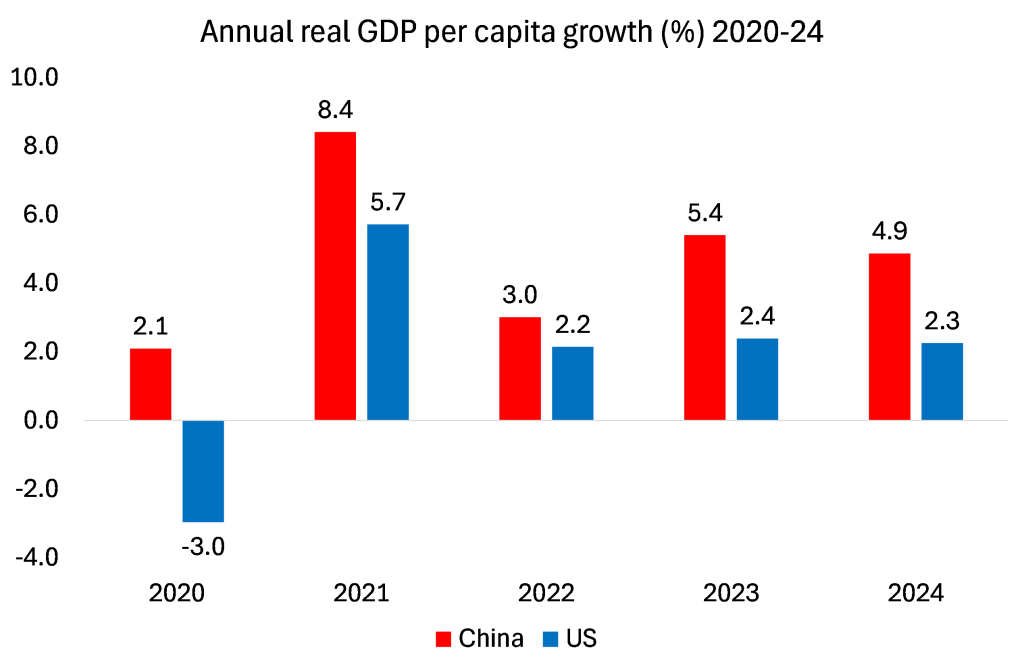
Moreover, the gap between China and the US on real GDP growth per person was even greater.
Inflation lower in China
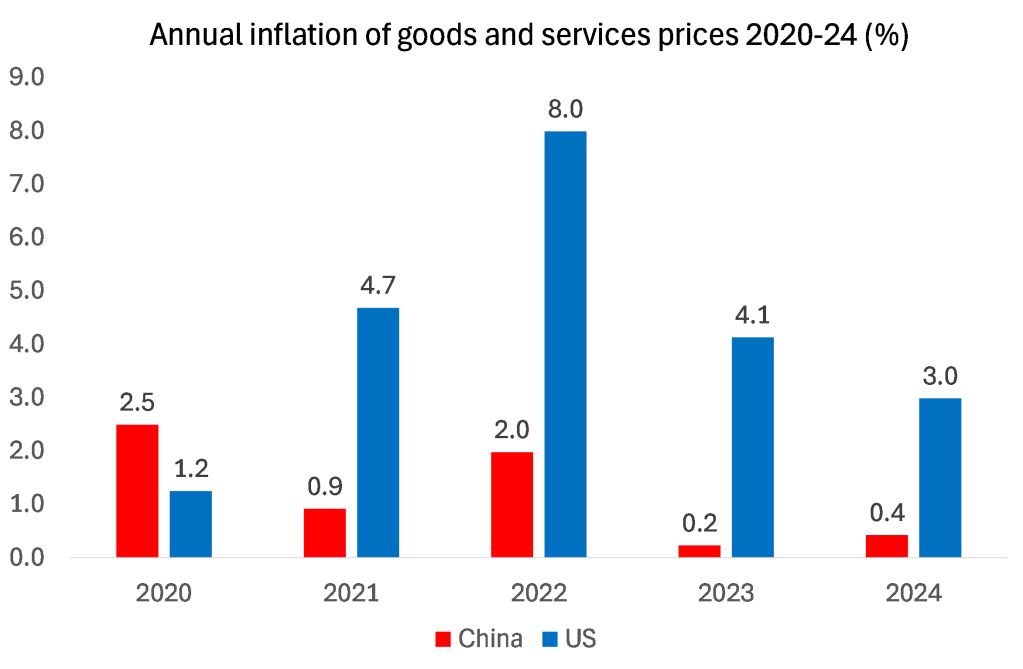
US annual inflation has been way higher than in China. Indeed, US prices rose a cumulative 21% since 2020 compared to just 3% in China.
Interest rates set by the US Fed are still at 4.5%, while the People’s Bank of China has a 3% rate. And interest rates on mortgages and corporate debt in the US are well above 5% compared to 1.5% in China. Average real disposable income in the US has been flat since 2019, while it has risen 20% in China. Under Biden, bridges fall down, roads crumble and rail networks hardly exist. Far from running a trade surplus of $1 trillion as China does, the US runs a sizeable trade deficit of $900bn.
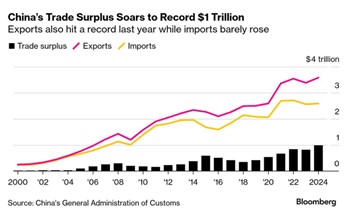
China’s current account surplus versus US defecit
While China runs a surplus on payments and receipts with other countries of around 1-2% of GDP a year, the US runs a current account deficit of 3-4% of GDP a year. At the same time, US industry and banks have huge net liabilities with the rest of world at 76% of GDP. Such a net liability would put all other countries vulnerable to a run on their currencies – but the US escapes this because the US dollar remains the world reserve currency. In contrast, China has a net asset position of 18% of GDP.
And yet, despite all this, we are continually told by Western ‘expert’ economists and the media that China is on the brink of financial meltdown (George Magnus); or alternatively going into permanent stagnation like Japan has done over the last three decades (Michael Pettis); and that China is producing too much that it cannot sell ie. it has overcapacity (Brad Setser). And China has a corporate debt crisis that will eventually bring the whole economy down (said by just about everybody). And China will stagnate because of a ‘lack of demand’, even though wage and consumption growth is way faster than in the US.
The Western consensus is that China is mired in huge debt, particularly in local governments and real estate developers. This will eventually lead to bankruptcies and a debt meltdown or, at best, force the central government to squeeze the savings of Chinese households to pay for these losses and thus destroy growth. A debt meltdown seems to be forecast every year by these economists, but there has been no systemic collapse yet in banking or in the non-financial sector. Instead, the state-owned sector has increased investment and the government has expanded infrastructure to compensate for any downturn in the over-indebted property market. If anything, it is America that is more likely to burst a bubble than China.
Differences between China today and 1980s Japan
And as for ‘Japanication’, this is also nonsense. In 1980s Japan, companies used property and land to lever up and buy more commercial property or expand into other economically unviable projects. When the bubble collapsed, the corporates and the banks carried the weight of the downturn. In contrast, the problems In China are in residential property, not in commercial.

Hence, China’s real estate prices never went up as much as during the land speculation frenzy in Japan in the 1980s. Average residential sales prices per square meter have risen 7.3% annually since 2007, well below the increase in annual nominal GDP of about 12% over that same period. In Tokyo, home prices grew 13% annually, well above nominal GDP growth of about 8% in the 1980s.
China is now the world leader in manufacturing
While Japan’s productive base declined from the 1990s, that is not happening in China. China is now the world’s manufacturing superpower. Its production exceeds that of the nine next largest manufacturers combined. It took the US the better part of a century to rise to the top; China took about 15 or 20 years. In 1995, China had just 3% of world manufacturing exports, By the beginning of Biden’s term, its share had risen to over 30%.
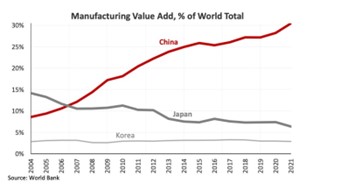
Does China have a demographic challenge and ‘overcapacity’?
Then there is China’s so-called demographic challenge of a declining workforce and population. But this decline is nowhere as severe as in Japan. China’s birth rate has been comfortably higher than those of Japan and the Asian tigers. China’s population under 20, at 23.3%, is still considerably higher than its Asian counterparts (16-18%) and not so far behind the US (25.3%) and above Europe (21.9%). The country’s 65 and older population, at 14.6%, is also lower than that of the developed world (20.5%).
As for so-called overcapacity, this is another myth broadcast by Western experts. China’s export success does not mean that China depends on exports for growth. China is growing mainly because of production for the home economy.
Remember, China’s economy has never suffered a decline in national output since 1949. And as John Ross has pointed out, if the Chinese economy continues to grow 4-5% a year over the next ten years, then it will double its GDP – and with a falling population, raise its GDP per person even more; ie more than two and half times as fast as the US.
State Owned Enterprises in China
Why is China exceptional? It is because it is an economy that is planned and led by state-owned companies, so it can ride most obstacles way better than a privately owned system of capitalist production as in the US. (Compare the US COVID death rate at 3,544 deaths per million to China’s 85 (latest figures). China’s most important industries are run by SOEs: finance, energy, infrastructure, mining, telecommunications, transportation, even some strategic manufacturing. The total capital of companies with some level of state ownership in China is 68% of total capital of all firms (40 million). The vast majority of Chinese companies in the Fortune Global 500 list are SOEs. SOEs generate at least 25% of China’s GDP in the most conservative estimates, and other studies have found them to contribute to 30-40+% of GDP.

Donald Trump takes over next week in the US. He wants to make America great again. He wants to make America ‘exceptional’. But that adjective best describes China, not the US.
From the blog of Michael Roberts. The original, with all charts and hyperlinks, can be found here.
The images of flags used in the featured image at the top of the article come from pixabay. The USA flag is from TheDigitalArtist. The Chinese flag is also from TheDigitalArtist.

